Thursday, August 5, 2021

2019 football only money between the P-5 (no basketball) (no conference TV)


Posted by Statefan on CSNBBS

...we present all 65 of the Power 5 schools, ranked from the most modest to most extravagant, for the 2019-20 fiscal year (generally 07/01/19 to 06/30/20).

These are annual university athletic department figures mandated by the U.S. Department of Education and its Equity in Athletics Data Analysis (EADA) arm. The headings represent the revenue derived from each university’s football operation before expenses, as listed by athletic directors of each school in their annual reports. These figures do not include the massive annual payouts from conferences’ broadcast contracts...

...these are revenue figures relating to the 2019 football season and the 2019-20 basketball season, not last season. So, they do not reflect the broad fiscal distress of the COVID-wracked and, in some cases, stunted 2020 football season, but do include decrease in funds from the lack of a 2020 NCAA men’s basketball tournament.

Because some irregularities in the reporting by various athletic directors is inevitable, the reports may include caveats and discrepancies between one school and another. We can’t control that. All we can do is pass on the parallel figures as they are posted in the EADA report.

Here, then are all 65, bottom to top, with number of ranking spots risen (+), fallen (-) or maintained the same (=) from the 2018-19 fiscal year, in parentheses. (Note: I've added italics to emphasize certain points, along with my comments in brackets and in color. - Hokie Mark)


#65 West Virginia $19 million (=)

#64 Wake Forest $24.7 million (-1)

No mystery here as announced crowds at Truist Field, even for a competitive 8-5 team, commonly ranged around 25-30K; that’s barely Conference USA level. Wake was also one of only three Power 5 schools to fabricate a balanced ledger – identical figures of $24,698,755 for revenue and expenses – indicating a true deficit compensated with general funds. [Why is Wake Forest in the ACC? - HM]

#63 Georgia Tech $28.2 million (-15)

A similar sad story here as native Georgian Geoff Collins came from Temple to relieve longtime triple-option proponent Paul Johnson and the Jackets sank into a 3-9 morass. Football eeked out a $1M profit and tumbled farther in one year than any program in the rankings. Men’s hoops ran a deficit of slightly over $1M. [Tough to motivate fans to pay to see a bad team play. - HM]

#62 Boston College $31.8 million (-1)

Seeing an ACC pattern here? This was the dreary 6-7 season that got Steve Addazio fired after seven years in Chestnut Hill. After an encouraging start, the tone was set in week 3 with a stunning rout home loss to 20-point underdog Kansas. BC football managed a $5.1M profit. Men’s hoops barely broke even (+$128K). [Good point: that Kansas loss probably killed demand for tickets the rest of the year - HM]

#61 Rutgers $32.9 million (+3)

#60 Vanderbilt $33.4 million (+2)

#59 Missouri $34.7 million (-4)

#58 Oregon State $35.6 million (=)

#57 California $36.1 million (+3)

#56 UCLA $37.5 million (-6)

#55 Pittsburgh $37.9 million (-2)

Heinz Field is exponentially nicer than old gray Pitt Stadium, but it’s not easy luring a university community down the hill from Oakland to watch a just-OK team play opponents from Tobacco Road. Pat Narducci has done all he can. Panther football lured consistent announced crowds of 40-45K and cleared $5.4M. Meanwhile, the struggling basketball program, blessed with a gorgeous campus venue and much more attractive conference opponents, managed just an $800K clearance. [Pitt probably lost more traditional rivals in realignment than any other P5 team. - HM]

#54 Arizona $39 million (-7)

#53 Duke $39.7 million (-2)

Rivaling Kentucky, Indiana and Kansas, this is the arguably most severe example of basketball overshadowing football. And so, it provides a window into just how much more important football is fiscally to college athletics. David Cutcliffe’s Devils went 5-7 (3-6 ACC) and yet the football program still cleared more profit ($14.5M) than Mike Krzyzewski’s basketball behemoth ($13.4M) which grossed among the most of all college hoops programs in the nation ($33.4M!) [Duke lost its appetite for big-time college football at least 70 years ago; they are what they are now. - HM]

#52 Mississippi State $40 million (+5)

#51 Kansas $40.6 million (+5)

#50 Stanford $40.9 million (-6)

#49 Syracuse $42.6 million (-4)

The beginning of the descent of the the once-promising Dino Babers regime at The Cuse FB began here with a 62-20 rout loss at Maryland and has not lost downward velocity. The Orange football program did manage $14.9M in profit while Jim Boeheim’s basketball operation made $8.7M. [If Babers can't win at least 5 or 6 games every year, he'll lose his fan base, then his job - HM]

#48 Virginia $43.4 million (+11)

One of the big success stories in major college football has been Bronco Mendenhall’s rehab job at UVA. The Cavs won the ACC Coastal, gave heavily favored Florida (-14) a fight in the Orange Bowl (36-28 loss) and finished 9-5. In so doing, Virginia football jumped 11 spots and made a $15.8M profit. Meanwhile, Tony Bennett’s defending national champion basketball program cleared just $2.4M. [One has to wonder how high, or low, the ceiling is for UVA football - HM]

#47 Washington State $44 million (-4)

#46 Kentucky $44.5 million (+3)

#45 Maryland $44.7 million (-6)

#44 Kansas State $45 million (-4)

#43 N. C. State $47.6 million (-2)

A very down year (4-8, 1-7 ACC) for Dave Doeren’s generally overachieving program still made $24.3M in profit. Men’s basketball cleared $5.6M. [Is the Wolfpack an overachiever, or are they just consistently underrated? - HM]

#42 Texas Tech $47.7 million (-7)

#41 North Carolina $48.7 million (+11)

With the possible exceptions of Dick Crum and Bill Dooley, Mack Brown is the most popular football coach UNC has ever had. And his return from retirement to Chapel Hill at age 68 was a big deal. Kenan Stadium sold out all six home dates and the Heels responded with a bowl season for the first time four years. UNC football cleared $18.2M which topped the much more popular basketball program ($17.1M) exp: $30.5M. [Brown is the draw, but how long can he continue coaching? - HM]

#40 Louisville $48.9 million (-2)

After the general embarrassment of Bobby Petrino’s second stint here that ended in his team quitting on him (and vice versa) at the close of 2018, interest was at a nadir. But Scott Satterfield, imported from a distinguished run at Appalachian State, was the right antidote. His first season went 8-5 (5-4 ACC) and his team fought. Louisville football cleared $24.2M. Meanwhile, Chris Mack’s basketball program gathered a phenomenal $40.7M gross (tops nationally) and profited $20.8M. [Cardinal fans really want to support their team, they just need something to root for. - HM]

#39 Arizona State $49.7 million (+15)

#38 Virginia Tech $50.3 million (-8)

Justin Fuente’s program began to take on water and notably lost to UVA for the first time in eons. Football managed $14.7M in profit. Basketball made $1.5M. [Fuente was trying to follow a legend with assistant coaches who couldn't recruit; 2021 will be a referendum year for the program - HM]

#37 Colorado $50.5 million (+9)

#36 Purdue $51.9 million (-5)

#35 Iowa State $52.1 million (-1)

#34 Mississippi $53 million (+3)

#33 Southern California $53.4 million (+3)

#32 Oklahoma State $53.5 million (+1)

#31 Indiana $56.5 million (+1)

#30 Baylor $56.6 million (+12)

#29 Miami (FL) $59.5 million (=)

Manny Diaz wanted the job at Miami so badly that he reneged on Temple after already accepting the position there. He just didn’t know the Canes would come after him four weeks prior. The jury remains out on him. This first season was The U’s first losing one in a dozen years since the Randy Shannon regime. Miami rolled up a whopping $48.9M in expenses, so it only cleared $10.6M. Jim Larranaga’s basketball shop indicated a deficit with both expenses and revenues an identical $9,209,237. [Diaz is building a roster, but just as important, he'd building buzz in South Florida - HM]

#28 Northwestern $59.5 million (-4)

#27 Texas Christian $61.2 million (-5)

#26 Minnesota $61.8 million (=)

#25 Utah $62.6 million (=)

#24 Clemson $63.1 million (+3)

You might think after all the recent national success, Clemson football would pull down more profit than it does. But it’s still a small-market program with a relatively average alumni base and no significant national cachet of adoration (such as, say Duke basketball or Notre Dame football), so the economic ceiling has about been reached. Dabo Swinney’s team again reached the national title game before losing to Louisiana State. But the profit after a whopping $55.9K expense outlay (no doubt, exacerbated by travel) was a mere $7.2M. Men’s hoop profit was $1.4K. [Small school plus limited history equals lower-than-expected TV, ticket demand... but it's growing - HM]

#23 Illinois $65.6 million (+5)

#22 Michigan State $68.9 million (-4)

#21 South Carolina $69.2 million (+2)

#20 Arkansas $70.3 million (-3)

#19 Florida State $71.1 million (+2)

Not to sully Mike Norvell who bears no responsibility, having not arrived yet from Memphis. But through the college athletic fiscal data I’ve seen since beginning this report four years ago and including 2019-20, this has to be the least efficient college football program of them all. Among other condemnations of the Willie Taggart era, his program posted a mind-bending expense ledger of $67.8M, tops nationally and 16% higher than runner-up Alabama – which sort of earned the right. His FSU program did not, going 6-7 on the heels of 5-7, culminating in his dismissal. That expense total left a profit of just $3.3M which is insane for a top-20 grossing program. Seminole hoops almost cleared as much – $2.6M. [FSU needs to shed the "doing less with more" cloak as quickly as possible! - HM]

#18 Oregon $77.6 million (+2)

#17 Texas A&M $78.1 million (+2)

#16 Iowa $81.4 million (=)

#15 Wisconsin $87.4 million (-2)

#14 Tennessee $91.6 million (-2)

#13 Washington $91.7 million (+2)

#12 Florida $94.9 million (+2)

#11 Louisiana State $95.1 million (=)

#10 Nebraska $95.8 million (=)

#9 Auburn $97.7 million (-2)

#8 Notre Dame $97.9 million (-4)

An ugly and inexplicable 31-point loss in the rain at Michigan pocked an otherwise very good 11-2 season. Other than USC, the home schedule wasn’t up to par and Irish football revenue dipped $17.6M from 2018-19. But when you’re hovering in 9-figure-gross territory, it’s not exactly a cataclysm. Men’s basketball, now part of the far-flung ACC, listed a deficit of $4.7M (travel?) and women’s basketball was worse ($5.0M). [Being a member of the ACC, playing 5 games per year in the footprint (10 games in 2020!) has been one of the best things for ND football in terms of exposure and recruiting - so, naturally, they don't want any more of it. Don't waste time figuring it out! - HM]

#7 Penn State $101.7 million (-1)

#6 Oklahoma $101.9 million (+2)

#5 Alabama $110.1 million (+4)

#4 Ohio State $115.5 million (+1)

#3 Michigan $125.8 million (=)

#2 Georgia $134.5 million (=)

#1 Texas $144.4 million (=)


Here are the ACC shown discretely:

Rank School Earnings
64 WF $24,7 M
63 GT 26.2 M (had Georgia, UNC, NC State, VT, and Pitt at home)
62 BC 31,8 M

55 Pitt 37.9 M
53 Duke 39,7 M
49 Syracuse 42 M
48 UVa 43 M

43 NC State 47.6 M (season ended with injury to QB - finished 4-8)
41 UNC 48.7 M (Brown turns UNC around hosted App State, Miami, Duke, Clemson, and UVa)
40 Louisville 48.9 M(Sorry I forgot)
38 VT 50.3 M (terrible home slate)

29 Miami 59 M
24 Clemson 63 M (hosted TAMU, FSU, and GT first game)
19 FSU 71.1 M (Weak home slate and bad team - hosted Boise State, Miami, Louisville, NC State)

8 Notre Dame 97.9 M (Hosted Navy, and Southern Cal)

What this shows is football and non football schools in focus. You can even break them out into tiers.


Stadium Size Rank - School

65 - WF
62 - Duke
61 - BC
55- Syracuse
51 - UNC
46 - GT
42 - NC State
37 - Louisville
34 - UVa
28 - Miami
27 - VT
26 - Pitt
19 - ND
18 - FSU
16- CU


Here are the stadium capacities I have:

Memorial Stadium Clemson 81,500
Doak Campbell Stadium Florida State (to be 70,000 after renovation)
Heinz Field Pittsburgh 68,400
Lane Stadium Virginia Tech 65,632
Hard Rock Stadium Miami 65,326
Scott Stadium Virginia 61,500
Cardinal Stadium Louisville 60,800
Carter Finley Stadium NC State 57,583
Bobby Dodd Stadium Georgia Tech55,000
Kenan Stadium North Carolina 50,500
Carrier Dome Syracuse 49,000
Alumni Stadium Boston College 44,500
Wallace Wade Stadium Duke 40,004
BB&T Field Wake Forest 31,500

All-Time AP Poll Appearances


2020 college football TV ratings & more


College Football TV Ratings


average TV ratings rankings for the last 4 years (a time where FSU couldn't have been worse) are as follows:

#7 ND
#8 OU
#9 clemson
#12 texas
#18 miami
#19 FSU

#20 SCar
#21 MsSt
#32 Miss
#33 Ark
#37 UK
#52 Miz
#53 Vandy


Sunday, August 1, 2021

FSU breaking ground on new research building


FSU breaking ground on new research building

Florida State University officials will break ground Monday on the Interdisciplinary Research and Commercialization Building in Innovation Park.  

FSU President John Thrasher, Interim Vice President for Research Laurel Fulkerson and Danfoss Turbocor President Ricardo Schneider are scheduled to make remarks prior to officials breaking ground.  

The 116,000-square-foot building in Innovation Park is designed to facilitate interactions in common lab space, core facilities and strategically placed collaboration spaces.

It will consist of three floors of mostly open bay labs, sized for up to 30 research groups, 24 postdoctoral researchers, and 155 graduate and undergraduates. 

It will house faculty from physics, chemistry and engineering among others, with a specific focus on materials science.

Funding for the $88 million center has come from the Florida Legislature and the FSU Research Foundation.


The arc of athletics: FSU President Thrasher reflects on the highs, lows and way forward

Interesting article.  This subject is confusing for FSU fans because he did a very solid job with academics, but athletically, he was a mess.  Some other issues not noted:

*In 2016, he extended the GOR until 2036, virtually giving away all of the value of FSU football to the weakest schools of the ACC.......for nothing.
*In 2016, he promoted Stan Wilcox , who is widely considered the worst AD in FSU history.
*In 2019, he hired David Coburn as AD, an insider at FSU who had no experience in college athletics and Thrashers college buddy.
*In 2019, he moved the FSU/Boise State game to Jacksonville for non football reasons (that is as nicely as it can be put). It was not well received.
*Booster #s went from over 20K to under 10K during his tenure.
*Thrasher badly mishandled the Childers situation. LOTS of big-time Boosters said goodbye with that one.

FSU has done very well in academics in his time, but like most FSU presidents.....his over involvement/micro management in athletics has only blown up in his/FSU's face.


The arc of athletics: FSU President Thrasher reflects on the highs, lows and way forward 

During his FSU tenure, he had the unenviable task of making the first FSU head football coach hire in over 40 years when Jimbo Fisher, who had been the head coach in waiting behind Bowden and led FSU from 2010 through 2017, bolted to take the Texas A&M job.

Thrasher is well aware that the aftermath of that departure may very well be his lasting legacy, at least for the immediate future.

"I know when everybody looks at football, they're gonna say Thrasher screwed football up, I've heard that a few times," Thrasher said.

In the wake of Fisher's departure, Thrasher and then-FSU AD Stan Wilcox moved fast to bring in Willie Taggart as his replacement. The hire of Taggart was officially announced on Dec. 5, 2017, just four days after Fisher left.

Thrasher admits he definitely learned some things from this first coaching search he conducted that helped him better understand the process for the second search that ended with the hire of current FSU coach Mike Norvell. But he's not willing to admit that the quick turnaround of the coaching search was a mistake.

"I wouldn't call them mistakes so much as we thought we had the right guy. I think a lot of people thought that at the time," Thrasher said.


As John Thrasher nears retirement, he doesn't want FSU 'left behind' in college football


In an exclusive sit-down interview with the Democrat, Thrasher talked candidly about what he thinks about the future of college football as well as the ACC and FSU's role in it.

"I just want us to be prepared..." Thrasher said.

"My point to (FSU director of athletics) David Coburn and to (new ACC commissioner) Jim Phillips is I don't want Florida State to be left behind. I consider us as part of the ACC, but I also know that we have a marquee name, Clemson has a marquee name. I think there might be people coming after us, I don't know, but we've got to be prepared no matter what the options are."


Thrasher understands how difficult such a change would be. However, he's also well aware of the big driving force behind these changes and how important it is that FSU doesn't get left behind, either as a part of the ACC or elsewhere.

"At the end of the day, it's all about money. It's about TV revenue, contracts. Nobody can leave a conference without a significant buyout penalty, including us, so it would have to be something very special for us to leave," Thrasher said.

"On the other hand, that doesn't mean we can't attract some other people. I think the ACC, when you put the academic side of what it's about today against any of the other conferences, we're head and shoulders (above), I think. That, to me, is attractive to some of the universities out there. Preparation, options, all that's on the table. We're getting prepared for whatever happens.


Saturday, July 31, 2021

Conference Expansion Rankings, etc


Below is a  metric comprised of other rankings for conference expansion value.   Schools highlighted in green are currently locked out of the 2 Super Conferences.  

From what I can tell from these reviews and other articles is that only schools in the Tope 20, MAYBE Top 25 have the value needed to justify expansion, IF the goal is increasing revenue.  Some schools that don't add much revenue maybe very valuable to a Super Conference based on other issues (UNC to B1G for AAU, location, etc).

These rankings are much softer as you get below top 25.  It is clear the financial justification falls off very fast.

But interesting chart for now as all schools in green are locked out of Supers and locked into significant revenue gaps.


1 Texas SEC
2 Ohio State B1G
3 Michigan B1G
4 Notre Dame Ind.
5 Alabama SEC
6 Georgia SEC
7 Penn State B1G
8 Florida SEC
9 LSU SEC
10 Oklahoma SEC
11 Auburn SEC
12 Texas A&M SEC
13 Wisconsin B1G
14 Iowa B1G
15 Tennessee SEC
16 Nebraska B1G
17 USC PAC
18 South Carolina SEC
19 Florida State ACC
20 Arkansas SEC
21 Clemson ACC
22 Michigan State B1G
23 Washington PAC
24 Oregon PAC
25 Miami ACC
26 Kentucky SEC
27 UCLA PAC
28 Arizona State PAC
29 Ole Miss SEC
30 Minnesota B1G
31 Louisville ACC
32 Virginia Tech ACC
33 Texas Tech Big 12
34 Oklahoma State Big 12
35 Missouri SEC
36 Mississippi State SEC
37 Kansas Big 12
38 Illinois B1G
39 North Carolina ACC
40 Indiana B1G
41 Utah PAC
42 Ga Tech ACC
43 West Virginia Big 12
44 Iowa State Big 12
45 Stanford PAC
46 Purdue B1G
47 Virginia ACC
48 Arizona PAC
49 Northwestern B1G
50 NC State ACC

Friday, July 30, 2021

Expansion Value and other data


https://csnbbs.com/thread-926475.html

Statistical Prospects For The ACC and B1G: Those Who Actually Add Value

ACC:
Average Gross Total Revenue: $106,455,758
Those Who Would Add Revenue:
1. Kansas
2. T.C.U.


Attendance: 47,706
Those Who Exceed The Attendance Average:
1. Iowa State
2. West Virginia
3. Oklahoma State
4. Texas Tech
5. Kansas State


********************************************


B1G:
Average Gross Total Revenue: $130,698,413
Those Who Would Add Revenue: (adjusted up 15.5 million B10 media diff)
1. Notre Dame
2. Florida State
3. Louisville
4. Washington
5. Stanford
6. Southern Cal
7. Clemson
8. U.C.L.A.
9. Miami (at the average)


Those Who Exceed The Attendance Average:
1. Clemson
2. Notre Dame
3. Washington


Teel: ACC 'seems positive and unified' with realignment talk ignited anew

In short, football accounts for 75-80% of conference revenue.

SO WHAT’S THE ACC’S MONEY PROBLEM?

Record numbers aside, the league’s average distribution ranked last among the Power Five conferences. Moreover, it lagged far behind the Big Ten’s $54.3 million and SEC’s $45.5 million, gaps that soon will widen.

While the ACC’s exclusive TV deal with ESPN runs through 2035-36, the Big Ten is negotiating new contracts that will start in 2023 and were projected, pre-COVID, to boost distributions to $70 million by 2025. The SEC already has announced a new arrangement that, starting in 2024, gives ESPN exclusive rights to its football and men’s basketball.

The notable change for the SEC and ESPN is the move of the league’s marquee 3:30 p.m., Saturday football game, currently aired on CBS, to ESPN/ABC. For that one weekly game, ESPN agreed to pay a reported $300 million annually, almost as much as it pays for the entire ACC sports portfolio.

Add the Texas and Oklahoma brands, and the SEC package becomes even more valuable.

the Big Ten Network launched in 2007, the SEC Network in 2014, the ACC Network in 2019. 


Realignment: How much value does a team bring to their conference?


I've been hearing a lot about how certain teams are a good fit/not a good fit for conferences and a lot of people arguing about how much value they would bring to the table. That said, it was a lot of talking heads making generalizations without much in the way of hard data. I took some time to try to valuate each team in regards to their conference deal to get a sense for what they are worth to the conference. While changing conferences does not equate to an even transfer of value (and quite frankly, UT and Oklahoma moving will likely destroy a lot of value), I thought it was good to get a directional sense of what moves might work.


Method

  • I took the revenue value each AD brought to their respective university and also their social media following (as a rough proxy for viewership which would be the holy grail) and tied it to each school (via USAToday and SkullSpark)

  • From there, I captured what each teams equal payout is under the current system, and compared to what their proportionate payout would be if it was entirely based on % of revenue and/or social media following

  • Finally, I used a weights of the two variables to create a weighted value


Findings

  • Top teams in each conference really carry the bottom of the conference. There is a lot more to gain jettisoning the bottom half of each conference rather than trying to snag a top tier team from another conference.

  • In that respect, Oklahoma and Texas leaving the B12 makes a ton of sense from their perspective, there just isn't much comparative value from a brand perspective when comparing to the next rung down.

  • For the B1G - the idea of raiding the PAC12 needs to be approached with a healthy amount of caution. The plan doesn't make a ton of sense unless you get Oregon and UW in the mix. The California schools aside from USC are going to be a major drag on the per team payouts as they don't bring nearly enough to the table in today's current landscape.

  • Key Point: as this expansion continues, there are <20 teams that have enough value to sway the B1G or SEC to push forward with additions while increasing the per team payout. It becomes a really difficult game of choosing who comes along with when adding to the conferences

Comments

  • I've come across a few valuations online via WSJ, Forbes etc. that all look they come from the same place and use profit as the value predictor. To me that seems like an absolute wrong way to value an organization that is a non-profit by nature and is closer to a growth stage company than corporation

  • Would have loved to include revenue growth rates and viewership in the model, but getting the data for colleges is like pulling teeth and just plain too hard for a pet project

  • Private school data is all estimated based on comps. I didn't even try for the AAC schools because I don't think there are great comps available

TLDR: Very few teams have enough value/reasoning to make a conference shift


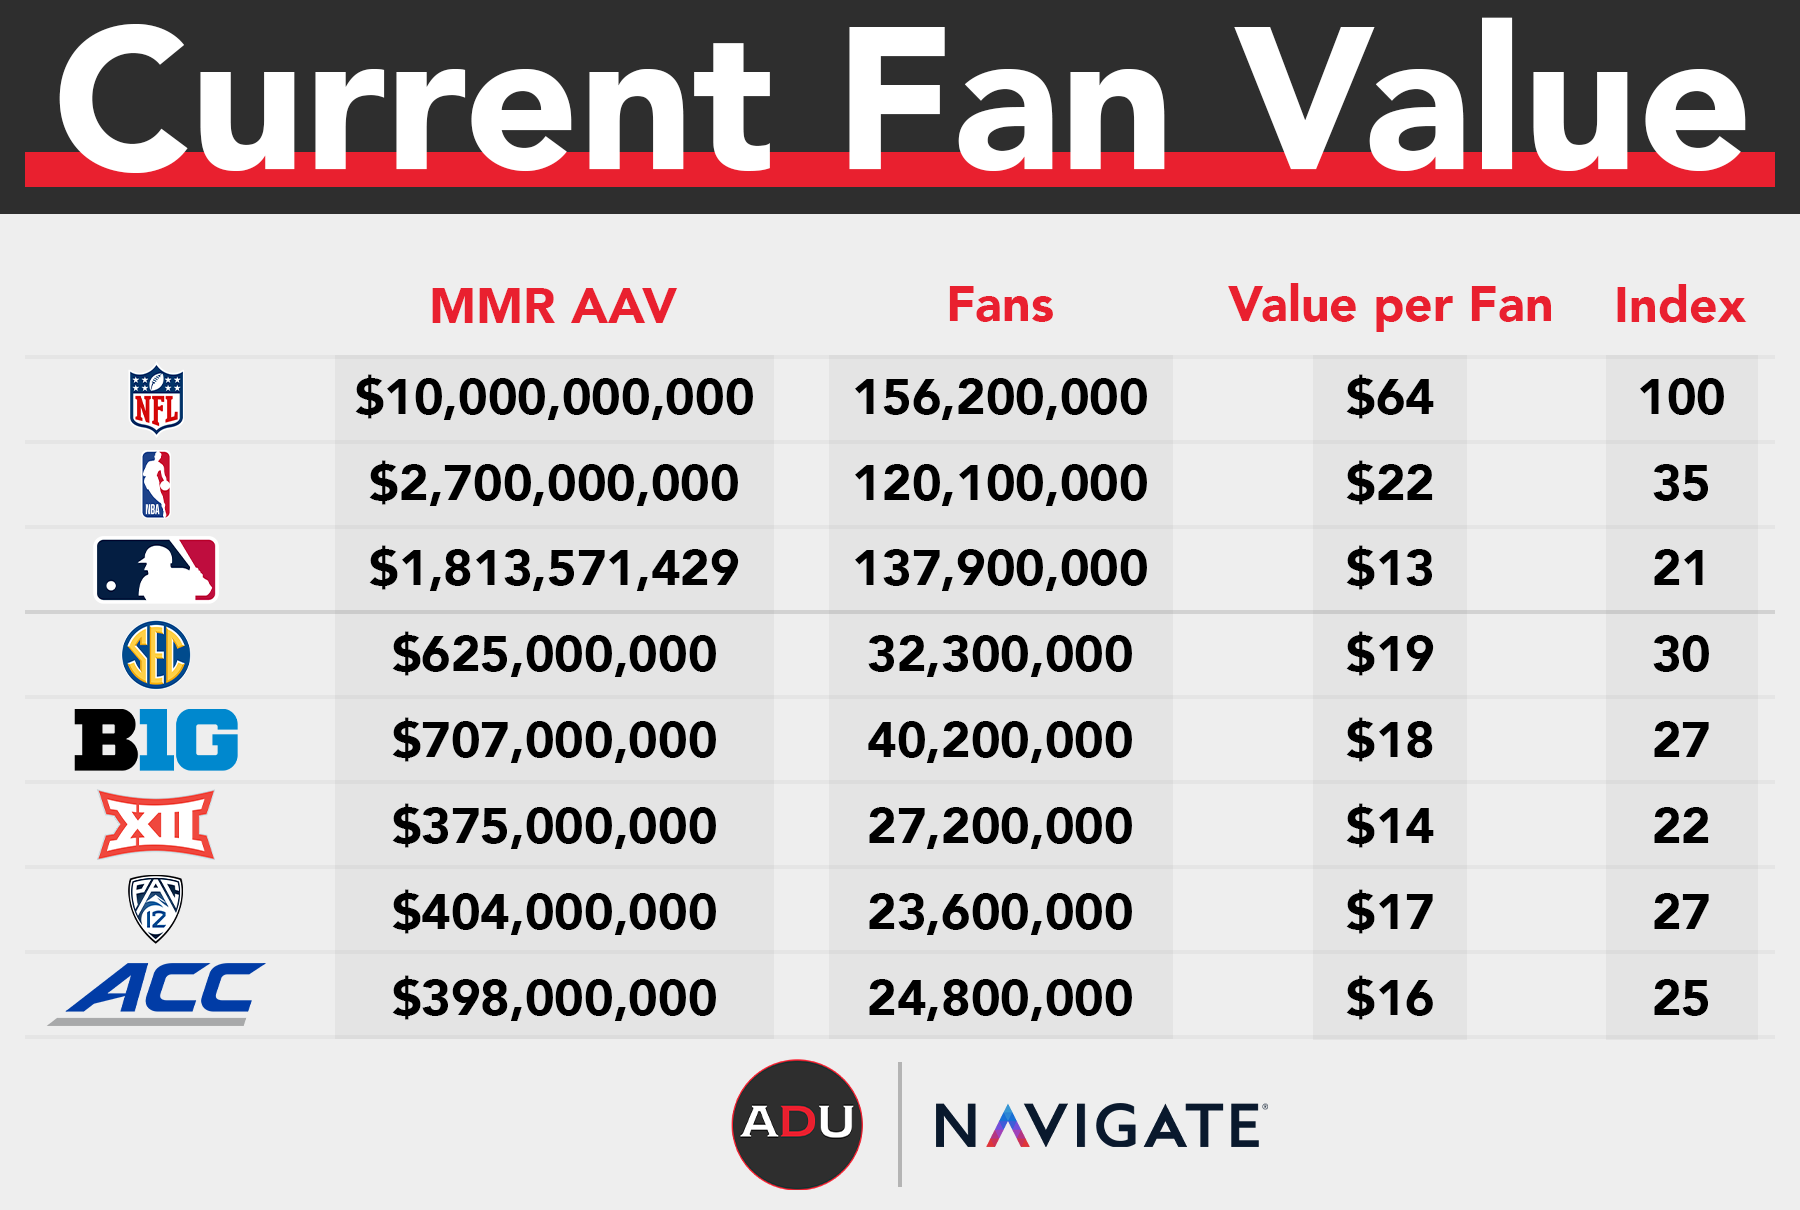
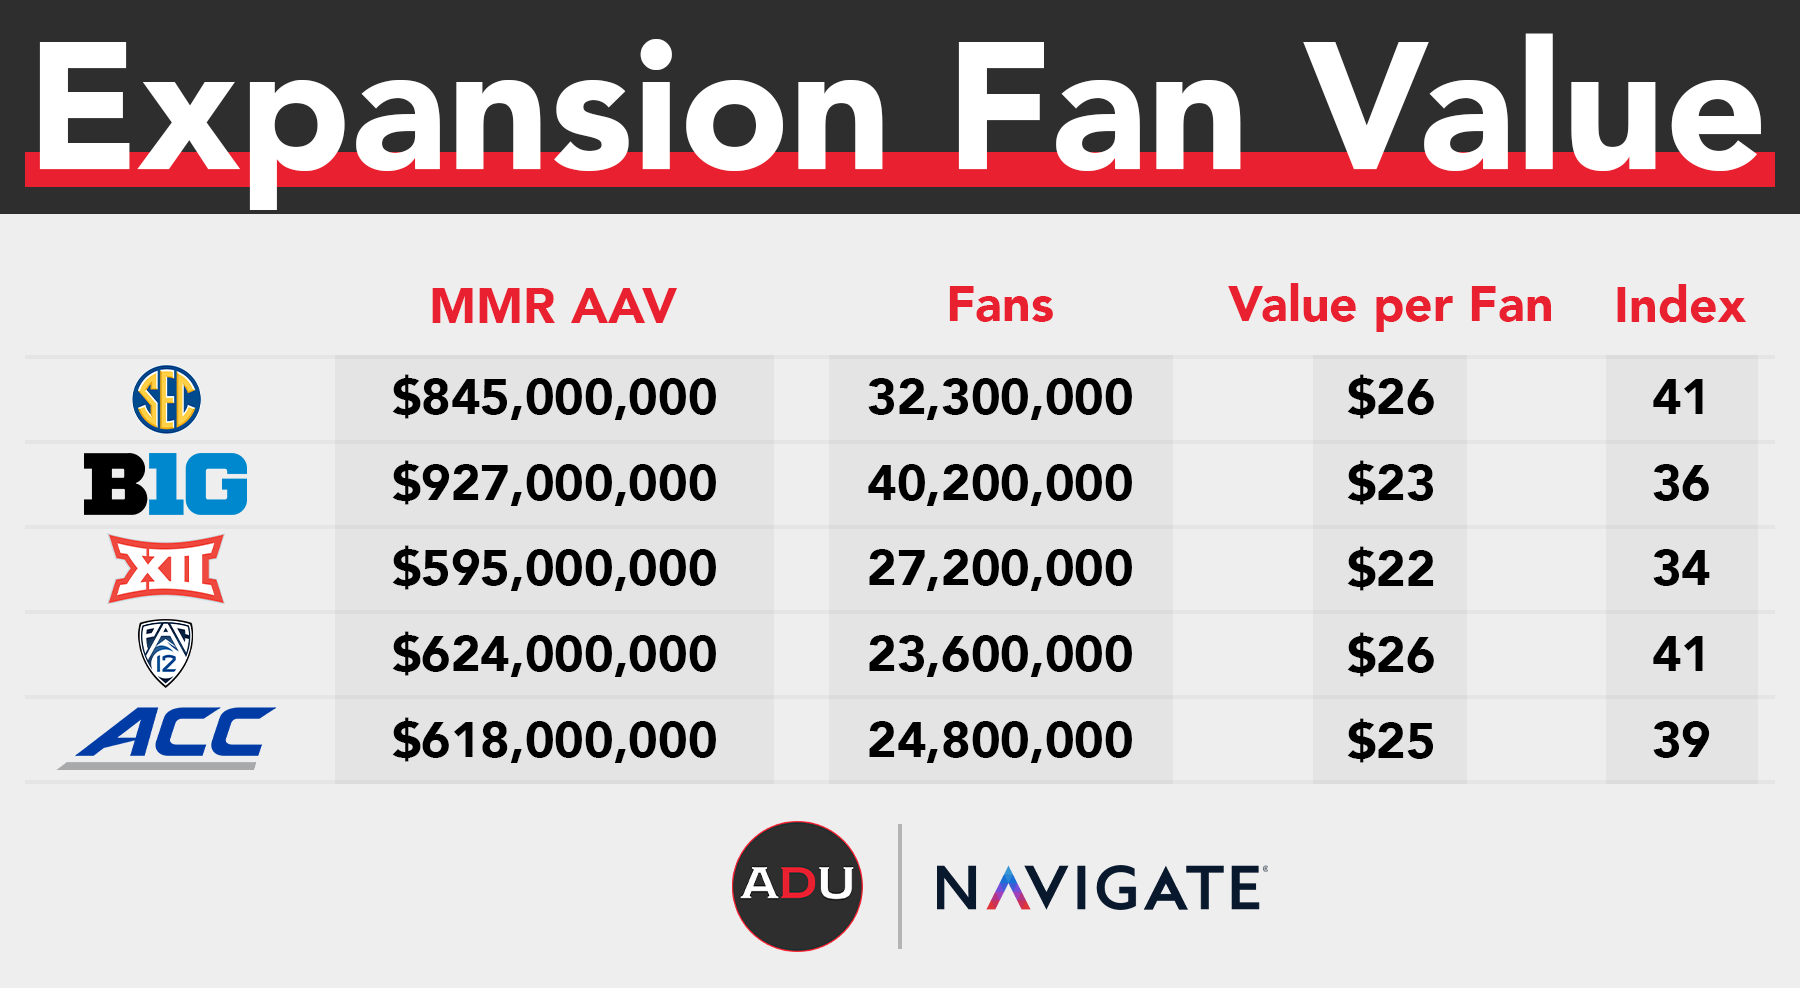
The chart above includes an index which allows us to compare the value per fan relative to the NFL for each league. The current CFP structure pays conferences around $103m per year, whereas an expanded 12-team playoff would pay closer to $323m per year, allowing us to create the below projections.


The current P5 average is only 26% of the way to NFL deals, while the new expansion would put college football closer to 38% of the way there. For perspective, 26% for now puts college football somewhere between NBA and MLB in terms of monetization, but the adjusted CFP would put college football above the NBA, which would be #2 among this comparison set.


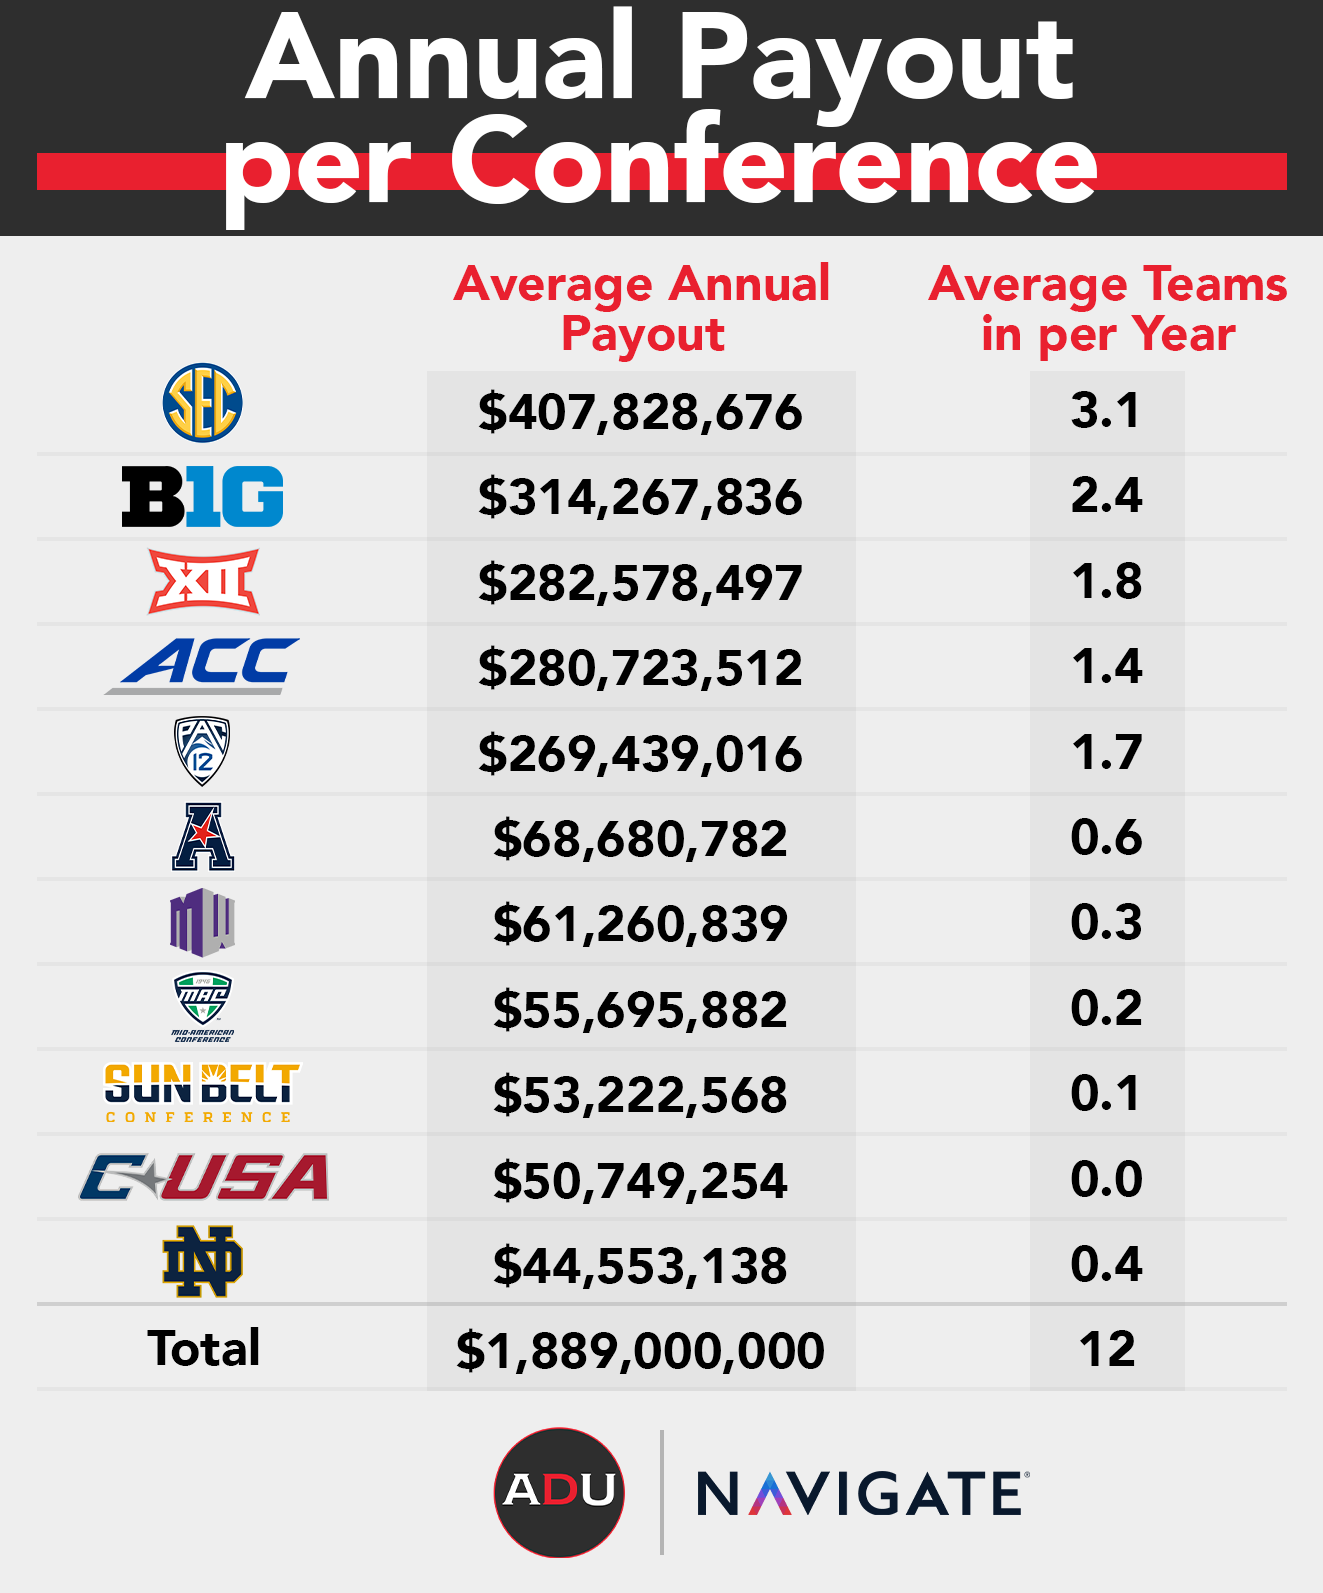
So how much money could a new 12-team CFP really generate on a per-conference basis? The below chart is our forecast and assumes the following:


  • The current CFP payout for NY6 bowl games – including the 3 CFP games – pays all conferences $670M per year


  • The new CFP payout for 11 playoff games that also take over all NY6 game relationships in a 12-team playoff  pays all conferences $1.9B per year


  • In the current model, 63% of payout goes towards base payments to conferences and the remaining 37% goes towards conferences in NY6 bowls and playoff games, which was also assumed in this new model


  • To allocate non-base payouts, we looked back at the last 10-years of college football performance and assumed the new proposed 12-team playoff rules are used for participation to estimate the number of teams included in the playoff each year


  • To estimate the value of each round participating, we assumed each round of the playoff sees increased TV viewership by 25%, and assigned values to each game, and totaled those estimates by conference and averaged them over the same 10-year timeframe


Our results show that had the 12-team model existed from the onset of the CFP,  the SEC would have averaged 3+ teams and over $400M in payouts per year with Big Ten next at 2+ teams and $300M+ each year, followed by Big 12, ACC and then Pac-12 in terms of payouts. It’s also very interesting to note that Notre Dame ends up in a very favorable position if this scenario plays out as they would have been included in the 12-team playoff about 30% of the time and keeping full game payouts as opposed to splitting between other conference members.


Of course, the big caveat here is that we don’t really know how funds would be distributed in this scenario, but if the rules are similar as they are today with some adjustments to NY6 payouts being linked with specific rounds of the playoffs instead of with conferences, this could be the result.


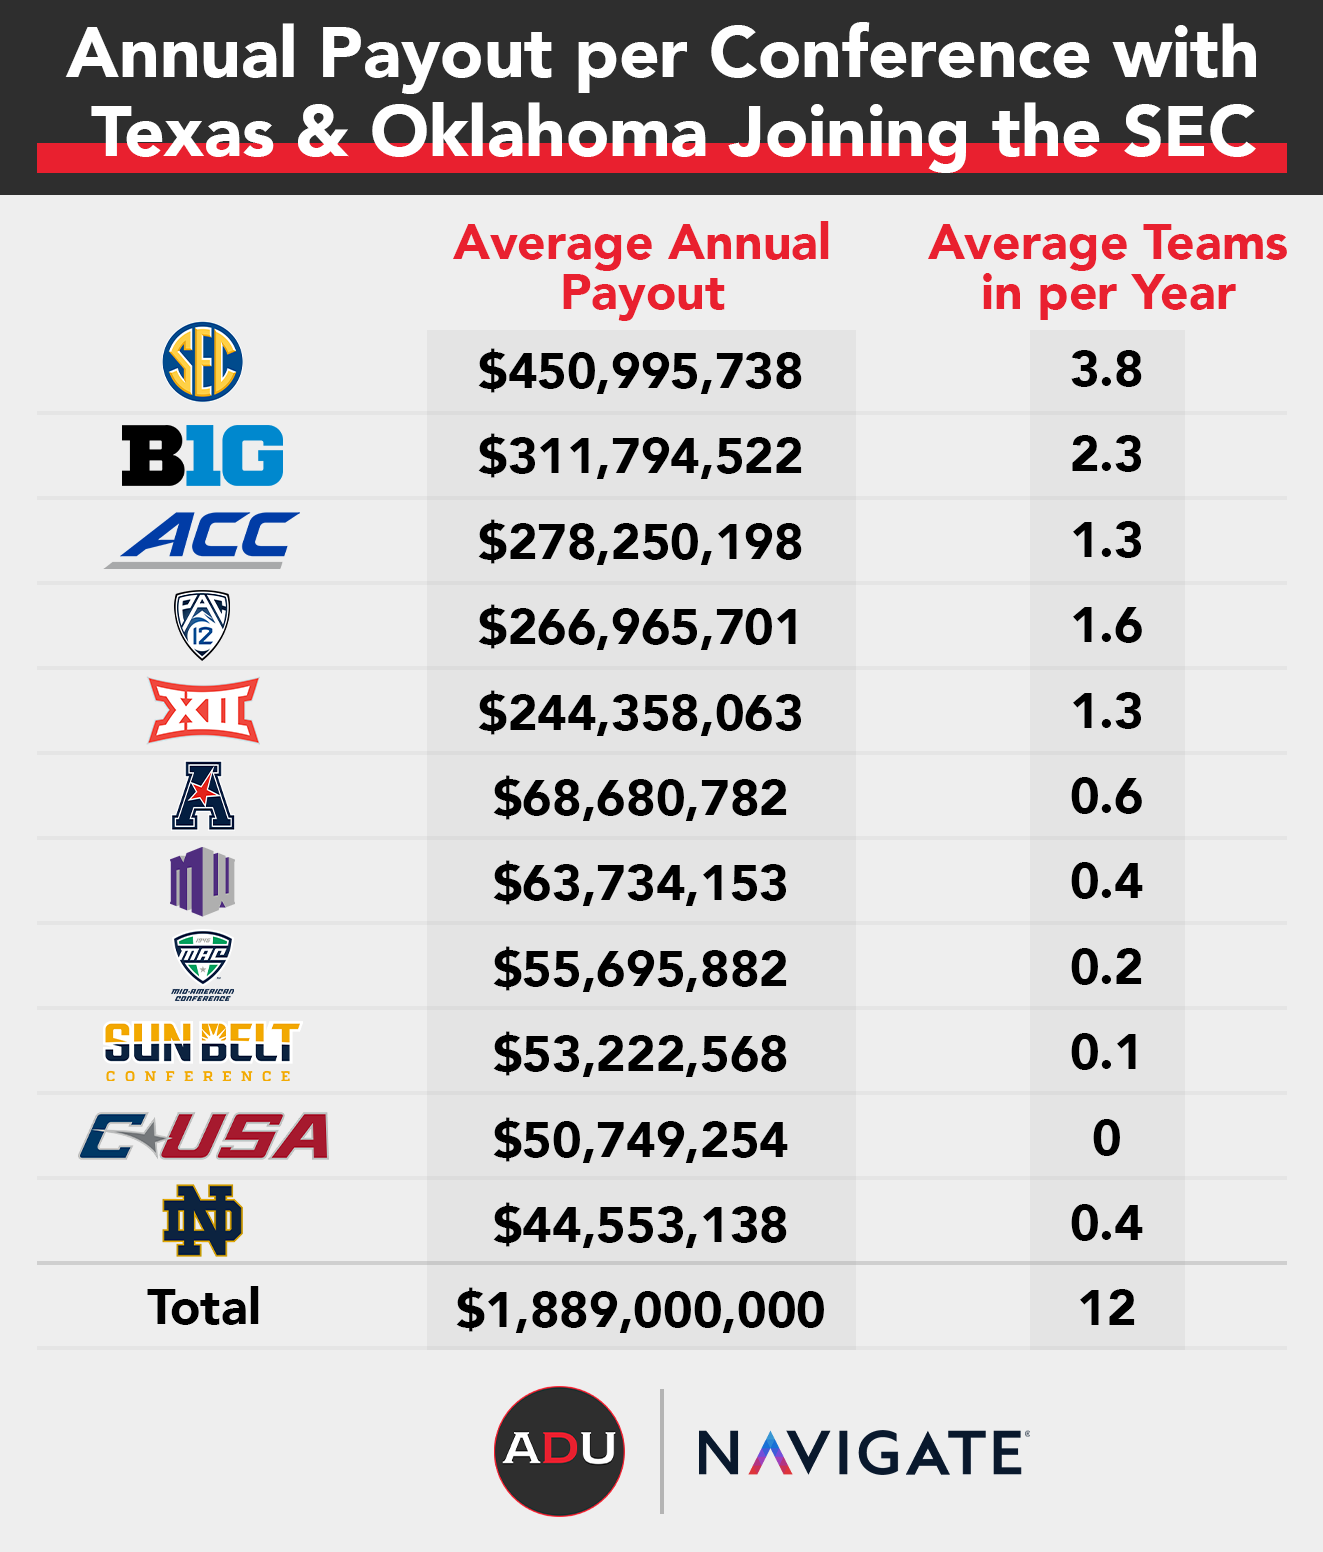
With news of Texas and Oklahoma possibly headed to the SEC, how would the this change the per-conference payout picture? As the chart below shows, the average payout per team for an SEC conference with 16 members is $28M, which is also the payout per member for the Big 12 before losing Texas and Oklahoma. So, the CFP payouts would essentially be the same under each scenario for UT and OU, but they’d face a much harder path to the expanded playoff by switching conferences.