How Do The Conferences Stack Up In Television Viewers?
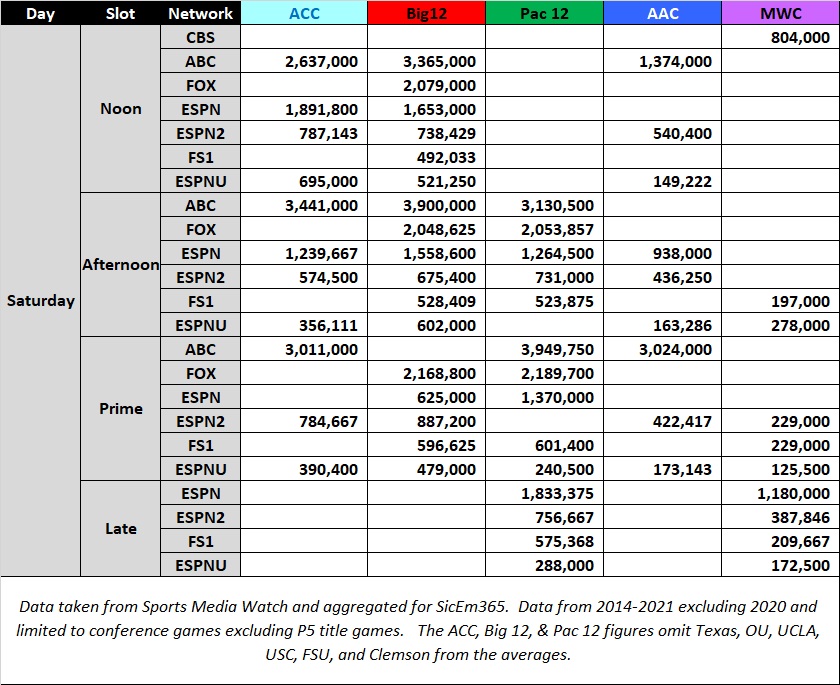
As you can see the SEC on CBS absolutely kills it in the afternoon and whenever they get a prime-time spot there. ABC typically cleans up in prime time as CBS and NBC usually don’t have games there and ABC had at least partial rights to every P5 school outside the SEC. The Big Ten tends to do very well on FOX’s noon slot, where FOX puts several of their best games.
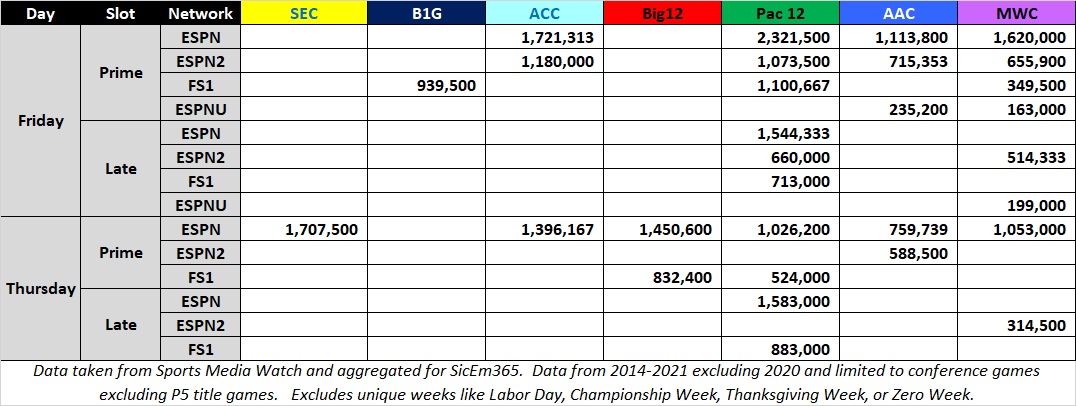
Below is how viewership stacks up on a typical Thursday or Friday. The SEC, ACC, Big 12, and Big Ten tend to show up less while the Pac 12, AAC, and MWC show a little more flexibility working with their TV partners. After realignment I expect the Big 12 to play more weeknight games to try for more revenue from television partners.
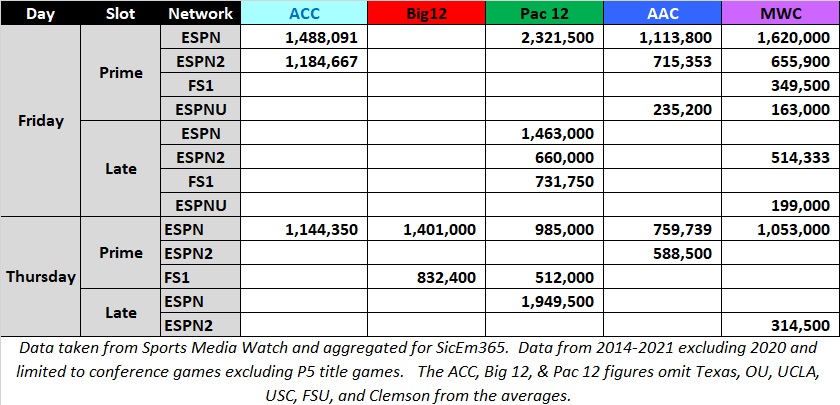
How did realignment impact the Big 12 or Pac 12 in this analysis? Losing Texas, Oklahoma, USC, and UCLA obviously weakens the television impact for those two leagues. Additionally, when you have the ACC commissioner being asked at media days about how strong the ACC grant of rights agreement is to potentially stop teams from leaving we can safely assume that there’s at least talk of schools like FSU, Clemson, or others potentially looking around for more money elsewhere. With that background, I also included how much omitting FSU or Clemson impacts the ACC. Below is the same analysis done on just conference games but excluding Texas, Oklahoma, USC, UCLA, Florida State, and Clemson. These are also compared to the pre-realignment 11 AAC teams and 12 team MWC for context.
What we see is that the remaining members of the P5 conferences perform substantially better than the intact AAC and MWC. Relative to each other there are some similarities. The Big 12 performs fairly well relative to the others listed on this chart. They perform better than competitors on the noon and afternoon ABC slot, the afternoon ESPN slot, and similar in the vast majority of the windows that they are not in first. We also have a breakdown below of how things look on Thursday and Friday.
How Do The Proportional Averages Look For The Conferences?
Below you see each of the conferences as a rolling average line for the top X number of games per school for the 2014-2021 seasons. This is including Texas and Oklahoma in the Big 12 line and includes USC and UCLA in the Pac 12 line. It also reflects schools in each conference prior to recent realignment.
Note: ALL regular season weeks & television windows other than P5 title games will be included in the following analysis as it’s more relevant to this metric. Bowls have not been included either.
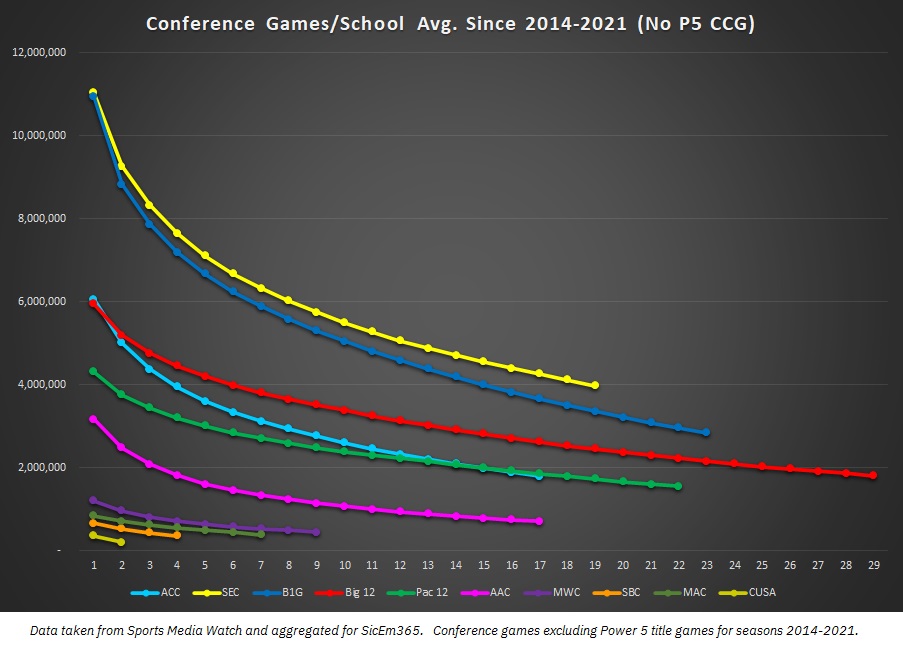
As we can see the SEC is ahead of everyone slightly but the Big Ten is tracking closer with them than most would expect from a simple average since the Big Ten had more games reach nationally rated networks. Next in the hierarchy is the Big 12, as it is neck and neck with the ACC for the top games but the Big 12 pulls away after those. Then it’s the ACC and Pac 12 who trade leads depending on what number of games you sample.
Among the G5 the AAC was the clear leader with the MWC as a clear No. 2. The MAC and Sun Belt took advantage of weeknight windows on ESPN networks to pull ahead of CUSA, who’s tv deal has very few nationally rated games and gets much less exposure.
This ranking is generally the same I’ve seen for individual years over the decade. It’s been the SEC, Big Ten, Big 12, and then depending on the year the ACC or Pac 12 would trade leads. The G5 typically was the AAC, MWC, then everyone else. However, 2021 had one big switch that I had not seen.
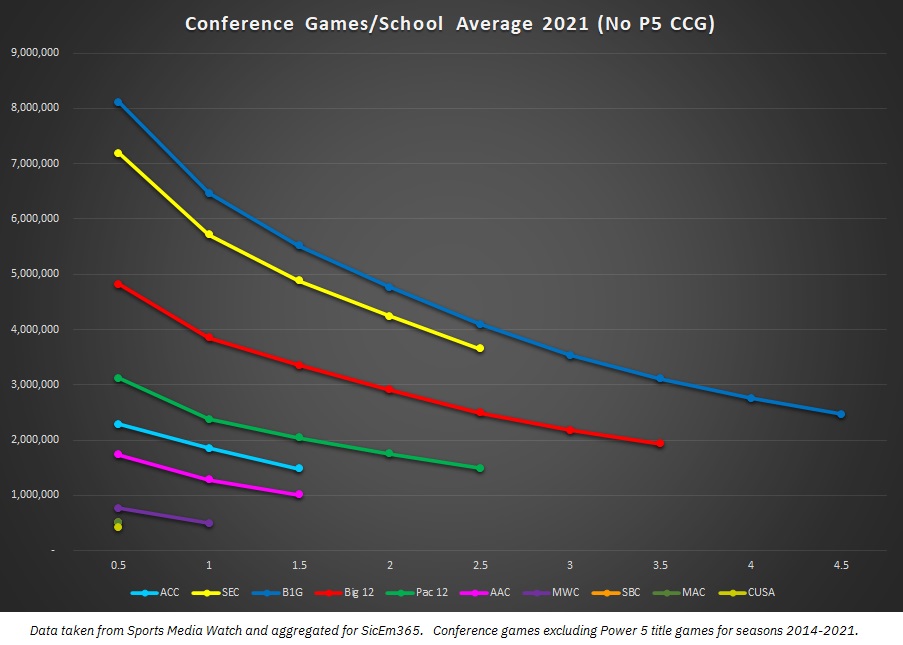
In 2021 the Big Ten actually averaged better than the SEC. Usually, the Big Ten is in shouting range but last year was a complete flip in the data. My best guess is that it was due to a year where LSU, Florida, and Auburn had down years while Michigan, Michigan State, Ohio State, and Penn State all had strong years or at least early parts of the year in the Big Ten East. Additionally, each of the first three also faced Nebraska which is a favorable cross-division draw for TV ratings as the Cornhuskers tend to be a stronger brand than most of their division. This led to more must-see games than usual for one group’s top brands and less than usual for the other’s. Both leagues have solid additional brands like Wisconsin, Tennessee, Penn State, Ole Miss, and others but when you have three of the top five brands in the SEC in a down year it will make an impact.
Additionally, we saw a down year from Clemson, FSU, and Miami. All three didn’t have their best seasons in recent memory, giving them a slip below the Pac 12.
What Does It Look Like After Realignment?
Obviously with Texas, Oklahoma, UCLA, USC, UCF, Houston, BYU, Cincinnati, and several CUSA schools moving around things can look different after realignment. Since these schools were not in a league together it makes for an awkward comparison but I followed these ground rules:
- Schools moving to a P5 conference carry their conference games with them. So Texas vs Oklahoma State helps the SEC line and USC vs Oregon helps the Big Ten line.
- Since the goal is to see how the conferences are performing without their departing members I have omitted P5 games against the departing members. So Texas vs Oklahoma State and USC vs Oregon do not count for the Big 12 and Pac 12. I also extended the “no UT and OU” rule to BYU, UH, Cincy, and UCF.
- Teams joining a league get their games against future league opponents included in the numbers.
- Since it really doesn’t impact the hierarchy, I left in the AAC games where one of the remaining eight AAC schools faced off vs UCF, Cincinnati, and Houston. I also didn’t redo the numbers for CUSA or the Sun Belt since the result is generally similar relative to the MWC and the MAC.
- BYU has no conference to pull conference games from. It’s not a reasonably fair projection to limit BYU to just games against G5 schools or just their P5 opponents since those include games against some giant brands like Michigan, LSU, and a couple of others. To be overly conservative I took their games against Nebraska, Michigan, Texas, USC, UCLA, LSU, Michigan State, Tennessee, and Washington out of the sample. Frankly, it doesn’t matter to the end result — the new Big 12 with all BYU games is slightly above the Pac “10”, virtually even with the PAC if we are ignoring BYU altogether using an 11-team sample, and roughly even-to-slightly-below them using just the games vs the G5 schools or their two games vs Baylor and WVU.
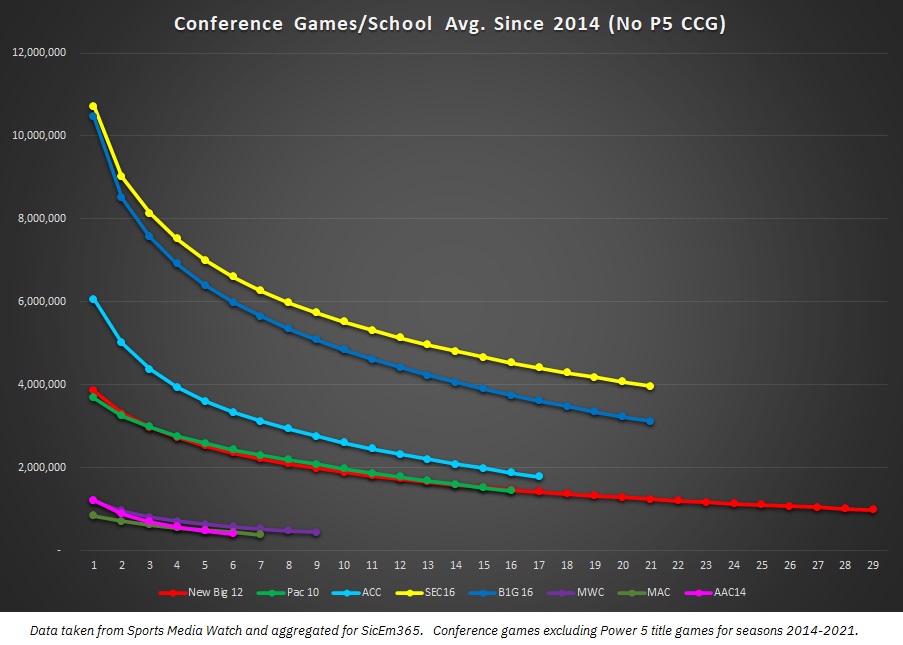
We see that the top two are relatively unchanged but the ACC vaults into third place instead of its annual 4th or 5th variations. The Big 12 and Pac “10” are brought virtually even after the Big 12 had a bigger loss with UT and OU but they started off ahead. However, given more favorable schedules than the AAC schools had and more relevant conference title implications than BYU’s independent schedule provided, it’s reasonable to expect the New Big 12 to perform marginally better than this projection.
What If The ACC Lost FSU, Clemson, or Possibly Miami?
With all of the articles out there speculating on the SEC or Big Ten wanting some combination of FSU, Clemson, Miami, North Carolina, UVA, VT, or NC State it’s safe to say there’s at least a decent chance of realignment hitting that league. It would be a dramatic hit to that league. Below we see how an “ACC 12” without FSU and Clemson would perform and how an “ACC 11” without those two or Miami has performed.
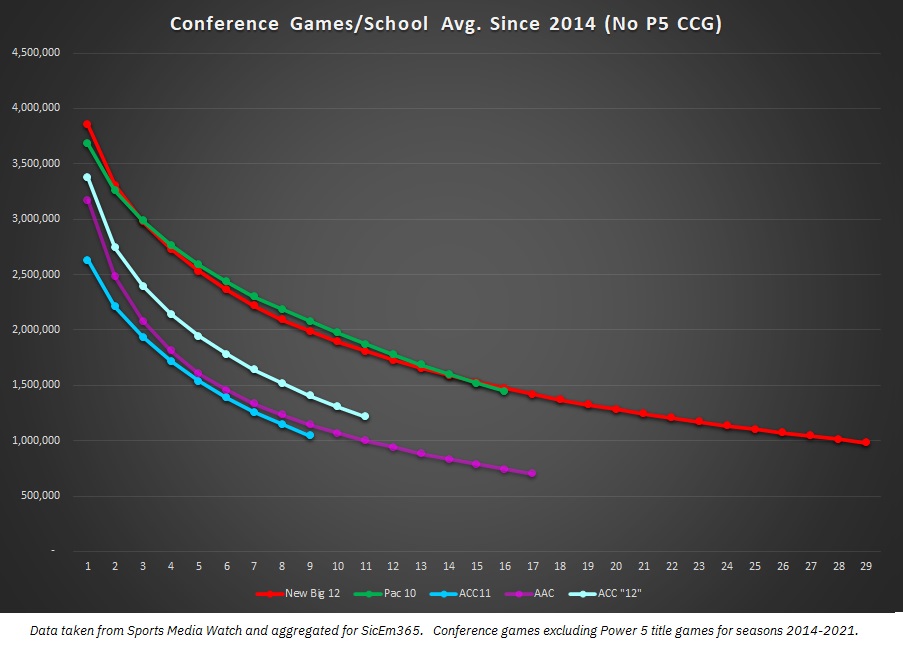
The resulting average isn’t favorable where it falls clearly behind both the new Big 12 and “Pac 10”’s current projected rosters come 2025. Additionally, the sample excluding Miami’s games as well falls behind the 11-team AAC that was anchored by Big 12 additions UCF, Cincinnati, and Houston.
Ultimately television ratings aren’t realignment value but they can give some general indications. Based on these projections I’ve run for several years it isn’t a shock that the SEC and Big Ten are getting such great contracts, and it isn’t shocking that the other three P5 leagues have lost at least one school to one of them. Each has several schools like Alabama, LSU, Auburn, Georgia, and Florida for the SEC and a group of Michigan, Ohio State, Penn State, Nebraska, Michigan State, and Wisconsin for the B1G. Additionally, they each have large state flagships and land grant schools that may not be blue bloods but command strong interest in their entire states like South Carolina, Texas A&M, Ole Miss, Iowa, Minnesota, and Illinois among several more.
My next and final article on television ratings will break down individual school averages and how schools stack up relative to each other. What has the television pecking order been like in the ACC? Who’s on top in the Big Ten? How do recent additions like Nebraska, Louisville, or Texas A&M show in their new conference? We’ll dive into that next time.
No comments:
Post a Comment