ACC Football/Basketball Facility, Stadium, Tradition, Investment rankings over time
FSU Facilities, ESPN narrative, and some rankings
FSU football spending (Update)
Ranking the 25 best facilities in college football
25. Florida
24. Texas Tech
23. Oregon State
22. Arkansas
21. TCU
20. Florida State
19. Washington
18. USC
17. Northwestern
16. North Carolina
15. Auburn
14. Notre Dame
13. Kentucky
12. Michigan
11. Georgia
10. Texas
9. LSU
8. Tennessee
7. OKLAHOMA
6. SOUTH CAROLINA
5. OHIO STATE
4. ALABAMA
3. TEXAS A&M
2. OREGON
1. CLEMSON
As part of a new five-year plan announced in September 2018, Florida State will join college football's arms race with a stand-alone football facility that will be built adjacent to the Dunlap Athletic Training Complex at a cost of $60 million. The Seminoles upgraded their current locker rooms at Doak Campbell Stadium in 2014 and has since added a nice player's lounge which puts FSU near the top of the ACC (but behind others of similar program prestige). With noticeable enhancements elsewhere nationally, the Seminoles tumbled a couple spots in these rankings since last season.
The 10 most attractive coaching jobs in college football
FSU #9 (UF #10)
USA Today recruiting budget rank
| Florida State | ACC | $1,581,347 | 271.4% |
Recruiting spending for Florida State football soared from $655,785 in 2016 to roughly $2.28 million in 2017, which led all 52 Power Five public schools that year and was more than $600,000 over the amount the Seminoles had budgeted for it.
Coburn was appointed FSU's athletic director in May after serving since August 2018 in an interim role, and he has spent much of his time in charge addressing an athletics department budget deficit, which has necessitated cuts.
During the 2018 fiscal year, FSU's recruiting costs for football dropped back to $1.58 million while Seminoles head football coach Jimbo Fisher departed in December 2017 for Texas A&M.
Coburn said the dramatic jump in recruiting costs in 2017 could have been because of changes in the accounting process. He added, "I suspect that there may have been more use of private planes that one particular year," but with sweeping changes since atop FSU's department and football program, Coburn said he couldn't "really find anyone who can give me a good explanation for that jump."
Fisher's new program at Texas A&M spent more than $1.71 million to recruit in 2018, well-exceeding its budgeted amount of $951,500.
Report reveals how much each CFB program spends on recruiting
Last week, Stadium released a report of how much money over 50 programs spent on recruiting in the 2018 fiscal year, and the amount of cash being thrown around is pretty surprising. Of all the programs that released their financial information, Georgia spent far and away the most on recruiting at over $2.5 million. In all, 15 teams on the list spent over $1 million trying to lock up elite recruiting classes, but was it worth it for many of them? The 10 programs that spent the most money on recruiting in the 2018 fiscal year are listed below.
1. Georgia | $2,626,622
2. Texas | $1,823,307
3. Clemson | $1,790,976
4. Texas A&M | $1,710,101
5. Florida State | $1,581,347
6. Michigan | $1,397,784
7. Penn State | $1,369,428
8. LSU | $1,287,344
9. Oklahoma | $1,264,809
10. Nebraska | $1,250,674
2. Texas | $1,823,307
3. Clemson | $1,790,976
4. Texas A&M | $1,710,101
5. Florida State | $1,581,347
6. Michigan | $1,397,784
7. Penn State | $1,369,428
8. LSU | $1,287,344
9. Oklahoma | $1,264,809
10. Nebraska | $1,250,674
https://watchstadium.com/news/this-is-how-much-it-costs-to-land-one-of-college-footballs-top-recruiting-classes-07-24-2019/
Stadium obtained the NCAA Financial Reports for the 2018 fiscal year for more than 50 FBS schools, most of which play in a Power Five conference. These reports are submitted to the NCAA annually, and they list detailed financial data regarding the operating revenue and expenses for each school’s athletic department.
That includes how much schools spent on recruiting.
Among the schools examined, Georgia’s $2.6 million spent on football recruiting in 2017-18 ranked first, and that spending yielded the No. 1 recruiting class in 2018, according to the 247Sports Composite rankings. On the opposite end of the spectrum, Houston ranked last among the programs examined at just over $250,000 spent on recruiting, which led to the Cougars enrolling the No. 73 recruiting class.
While there’s a parallel conversation to be had regarding the relationship between recruiting rankings and wins in college football, and which schools over- or under-achieved based upon the star-rankings of the players they enroll, there’s no denying that there’s a correlation between the amount schools spend on recruiting and their recruiting class rankings.
The scatter plot below presents that type of relationship for 51 FBS schools, showing the football recruiting expenses listed on each school’s NCAA Financial Report for the 2018 fiscal year (x-axis) and each school’s corresponding 2018 recruiting class ranking, according to the 247Sports Composite rankings (y-axis).
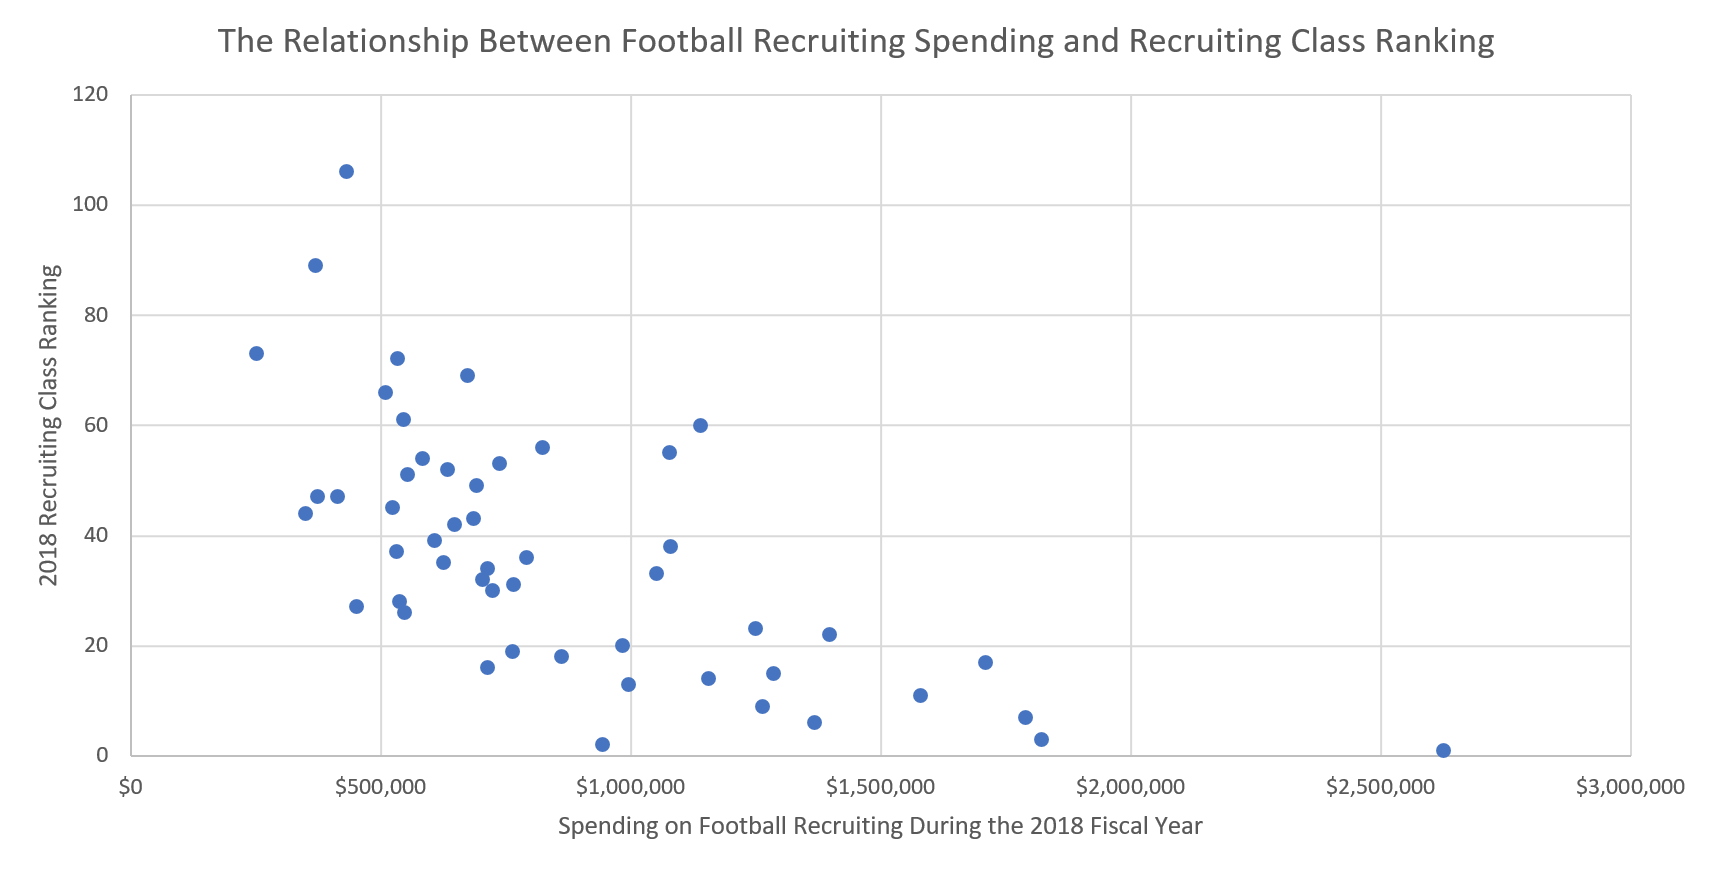
Here’s the same chart, but labeled with the schools that spent at least $1 million, or close to it, on recruiting.
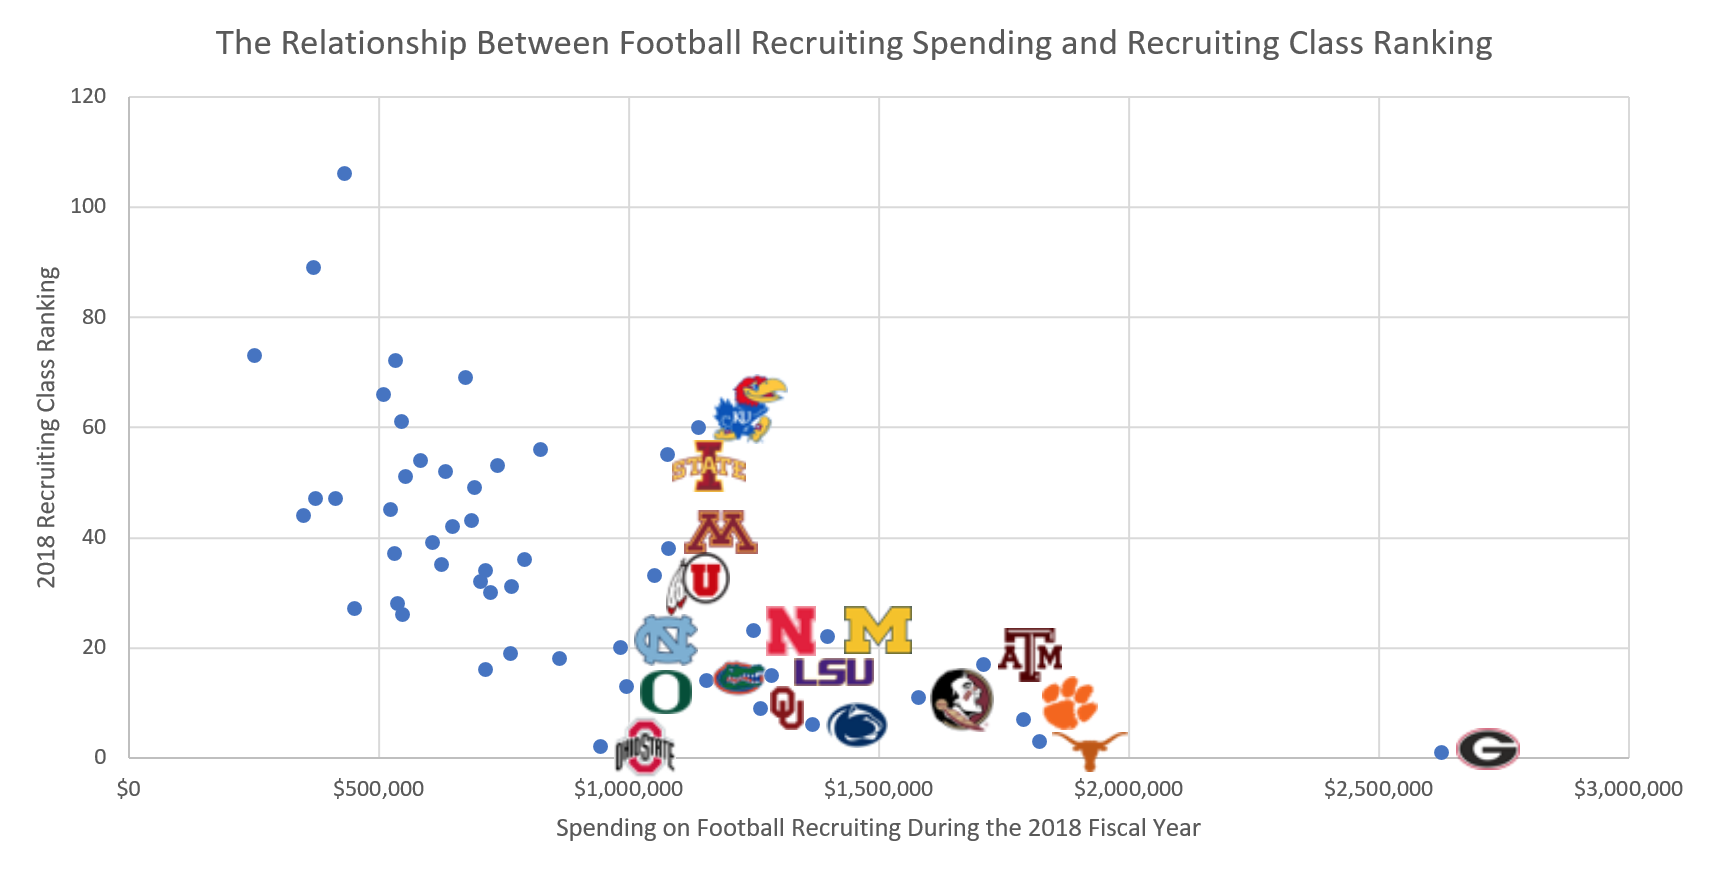
Generally speaking, there’s a negative relationship between spending and class ranking, meaning the more a school spends on recruiting, the lower (read: better) its recruiting class ranking will be.
Sure, there are exceptions like Kansas’ $1.14 million spent on recruiting resulting in the No. 60 recruiting class in 2018 and Mississippi State pulling in the No. 27 class despite barely spending over $450,000, but those exceptions hint at the impact that a school’s recent and historical success (or the lack thereof) has in recruiting.
We’ll touch on the roles that those factors play in recruiting later, but first, here’s the complete breakdown of the football recruiting expenses for the schools examined from the 2018 fiscal year and how each school’s 2018 and 2019 recruiting classes ranked.
The schools are listed in descending order of their football recruiting expenses from last fiscal year. The first column, labeled “Power Five Spending Ranking,” lists where each school’s recruiting spending in 2018 ranked among the Power Five schools examined.
Note: Football recruiting data for Alabama, Arkansas, Auburn, Tennessee, Virginia and Virginia Tech is unavailable due to state records laws. Baylor, Boston College, Duke, Miami (FL), Northwestern, Notre Dame, Stanford, Syracuse, TCU, USC, Vanderbilt and Wake Forest are private institutions, which means they’re exempt from public records laws. Pittsburgh is a state-related institution, which means it is not subject to state records laws.
| Power Five Spending Ranking Among Schools Examined | School | Football Recruiting Expenses in FY18 | 2018 Recruiting Class Ranking | 2019 Recruiting Class Ranking | 4/5-Star Recruits in Last Two Classes |
| 1 | Georgia | $2,626,622 | 1st | 2nd | 42 (30/12) |
| 2 | Texas | $1,823,307 | 3rd | 3rd | 36 (32/4) |
| 3 | Clemson | $1,790,976 | 7th | 10th | 25 (19/6) |
| 4 | Texas A&M | $1,710,101 | 17th | 4th | 29 (27/2) |
| 5 | Florida State | $1,581,347 | 11th | 19th | 22 (22/0) |
| 6 | Michigan | $1,397,784 | 22nd | 8th | 23 (21/2) |
| 7 | Penn State | $1,369,428 | 6th | 13th | 33 (29/4) |
| 8 | LSU | $1,287,344 | 15th | 5th | 27 (23/4) |
| 9 | Oklahoma | $1,264,809 | 9th | 6th | 29 (25/4) |
| 10 | Nebraska | $1,250,674 | 23rd | 18th | 13 (13/0) |
| 11 | Florida | $1,155,802 | 14th | 9th | 30 (30/0) |
| 12 | Kansas | $1,141,379 | 60th | 68th | 3 (3/0) |
| 13 | Minnesota | $1,081,075 | 38th | 45th | 3 (3/0) |
| 14 | Iowa State | $1,079,430 | 55th | 46th | 3 (3/0) |
| 15 | Utah | $1,052,271 | 33rd | 42nd | 6 (6/0) |
| 16 | Oregon | $997,019 | 13th | 7th | 24 (23/1) |
| 17 | North Carolina | $984,871 | 20th | 32nd | 11 (11/0) |
| 18 | Ohio State | $944,354 | 2nd | 14th | 35 (29/6) |
| 19 | South Carolina | $861,747 | 18th | 17th | 15 (14/1) |
| 20 | Rutgers | $824,271 | 56th | 64th | 0 (0/0) |
| 21 | Kentucky | $791,863 | 36th | 34th | 6 (6/0) |
| 22 | Michigan State | $766,139 | 31st | 30th | 5 (5/0) |
| 23 | UCLA | $764,620 | 19th | 40th | 10 (10/0) |
| 24 | Illinois | $739,680 | 53rd | 53rd | 5 (5/0) |
| 25 | Louisville | $724,742 | 30th | 70th | 5 (5/0) |
| 26 | Oklahoma State | $715,492 | 34th | 38th | 5 (5/0) |
| 27 | Washington | $714,872 | 16th | 16th | 25 (25/0) |
| 28 | Ole Miss | $704,836 | 32nd | 22nd | 11 (10/1) |
| 29 | Indiana | $692,972 | 49th | 36th | 3 (3/0) |
| 30 | Missouri | $685,834 | 43rd | 37th | 3 (3/0) |
| 31 | Oregon State | $674,239 | 69th | 66th | 0 (0/0) |
| 32 | Cal | $647,842 | 42nd | 43rd | 3 (3/0) |
| 33 | Colorado | $635,077 | 52nd | 44th | 2 (2/0) |
| 34 | West Virginia | $626,311 | 35th | 48th | 4 (4/0) |
| 35 | Iowa | $608,755 | 39th | 41st | 3 (3/0) |
| 36 | Georgia Tech | $585,680 | 54th | 51st | 3 (3/0) |
| 37 | Purdue | $555,565 | 51st | 25th | 5 (5/0) |
| 38 | NC State | $548,062 | 26th | 29th | 10 (10/0) |
| 39 | Arizona | $545,968 | 61st | 54th | 1 (1/0) |
| 40 | Maryland | $539,299 | 28th | 47th | 7 (7/0) |
| 41 | Texas Tech | $535,362 | 72nd | 61st | 1 (1/0) |
| 42 | Arizona State | $531,807 | 37th | 31st | 6 (6/0) |
| 43 | Washington State | $523,791 | 45th | 65th | 2 (2/0) |
| 44 | Kansas State | $509,760 | 66th | 62nd | 0 (0/0) |
| 45 | Mississippi State | $453,116 | 27th | 24th | 12 (11/1) |
| (Non-Power Five) | Connecticut | $432,480 | 106th | 126th | 0 (0/0) |
| (Non-Power Five) | Boise State | $414,229 | 57th | 50th | 6 (6/0) |
| (Non-Power Five) | Cincinnati | $374,630 | 47th | 79th | 1 (1/0) |
| (Non-Power Five) | East Carolina | $369,776 | 89th | 78th | 0 (0/0) |
| 46 | Wisconsin | $350,695 | 44th | 28th | 4 (3/1) |
| (Non-Power Five) | Houston | $251,975 | 73rd | 73rd | 0 (0/0) |
Another interesting lens to examine the investment FBS schools put into their football programs is to compare a school’s football recruiting spending to its total investment into recruiting prospective student-athletes across all sports.
A lot of the institutions examined are considered “football schools” due to football being their highest revenue-generating sport, but the data below shows just how big of a priority football recruiting is to each university in the context of its entire athletic department.
It shouldn’t be a surprise to see Georgia, Clemson, Florida State, Texas and Texas A&M atop the chart.
The financial numbers listed below are also from the 2018 fiscal year.
| School | Football Recruiting Spending | Recruiting Spending For All Sports | Percent Spent On Football |
| Georgia | $2,626,622 | $3,990,422 | 65.8% |
| Clemson | $1,790,976 | $2,804,471 | 63.8% |
| Florida State | $1,581,347 | $2,557,066 | 61.8% |
| Texas | $1,823,307 | $3,199,072 | 56.9% |
| Texas A&M | $1,710,101 | $3,036,727 | 56.3% |
| Colorado | $635,077 | $1,144,052 | 55.5% |
| Utah | $1,052,271 | $1,964,161 | 53.5% |
| Boise State | $414,229 | $773,739 | 53.5% |
| Oregon | $997,019 | $1,878,901 | 53.0% |
| Iowa State | $1,079,430 | $2,038,311 | 52.9% |
| North Carolina | $984,871 | $1,883,458 | 52.2% |
| Penn State | $1,369,428 | $2,708,778 | 50.5% |
| Oklahoma | $1,264,809 | $2,542,581 | 49.7% |
| Florida | $1,155,802 | $2,329,421 | 49.6% |
| Nebraska | $1,250,674 | $2,545,583 | 49.1% |
| Kansas | $1,141,379 | $2,326,971 | 49.0% |
| Minnesota | $1,081,075 | $2,215,207 | 48.8% |
| LSU | $1,287,344 | $2,661,602 | 48.3% |
| UCLA | $764,620 | $1,620,167 | 47.1% |
| Oregon State | $674,239 | $1,443,224 | 46.7% |
| Michigan | $1,397,784 | $3,011,982 | 46.4% |
| Cal | $647,842 | $1,397,437 | 46.3% |
| East Carolina | $369,776 | $805,605 | 45.9% |
| Michigan State | $766,139 | $1,689,263 | 45.3% |
| Georgia Tech | $585,680 | $1,313,034 | 44.6% |
| Rutgers | $824,271 | $1,881,103 | 43.8% |
| Cincinnati | $374,630 | $856,882 | 43.7% |
| Ole Miss | $704,836 | $1,683,435 | 41.8% |
| Missouri | $685,834 | $1,657,753 | 41.3% |
| Maryland | $539,299 | $1,308,607 | 41.2% |
| Washington State | $523,791 | $1,269,423 | 41.2% |
| Washington | $714,872 | $1,740,611 | 41.0% |
| South Carolina | $861,747 | $2,128,667 | 40.4% |
| West Virginia | $626,311 | $1,546,908 | 40.4% |
| Oklahoma State | $715,492 | $1,817,717 | 39.3% |
| Louisville | $724,742 | $1,847,150 | 39.2% |
| Purdue | $555,565 | $1,459,650 | 38.0% |
| Kansas State | $509,760 | $1,391,023 | 36.6% |
| Arizona | $545,968 | $1,495,385 | 36.5% |
| Houston | $251,975 | $698,178 | 36.0% |
| Illinois | $739,680 | $2,069,031 | 35.7% |
| Iowa | $608,755 | $1,712,668 | 35.5% |
| Arizona State | $531,807 | $1,543,683 | 34.4% |
| Ohio State | $944,354 | $2,819,239 | 33.4% |
| Mississippi State | $453,116 | $1,353,555 | 33.4% |
| Indiana | $692,972 | $2,125,054 | 32.6% |
| NC State | $548,062 | $1,781,451 | 30.7% |
| Connecticut | $432,480 | $1,406,823 | 30.7% |
| Kentucky | $791,863 | $2,718,456 | 29.1% |
| Texas Tech | $535,362 | $1,833,803 | 29.1% |
| Wisconsin | $350,695 | $1,224,327 | 28.6% |
Conference Comparison
Here’s a conference-by-conference look at how much every Power Five school spends on recruiting across all sports and what percentage of that money goes towards football recruiting.
While we can’t obtain the NCAA Financial Report for private schools or schools from certain states due to state records laws, we can find out how much schools spent on recruiting across all men’s and women’s sports through their Equity in Athletics Data Analysis reports, which are publicly accessible.
For each conference, the schools are listed in ascending order of their total recruiting spending.
ACC

Football recruiting data for Boston College, Duke, Miami (FL), Syracuse and Wake Forest is unavailable since they’re private institutions. Data for Pittsburgh is unavailable since it’s a state-related institution. Data for Virginia and Virginia Tech is unavailable due to the state’s public records laws.
Big 12
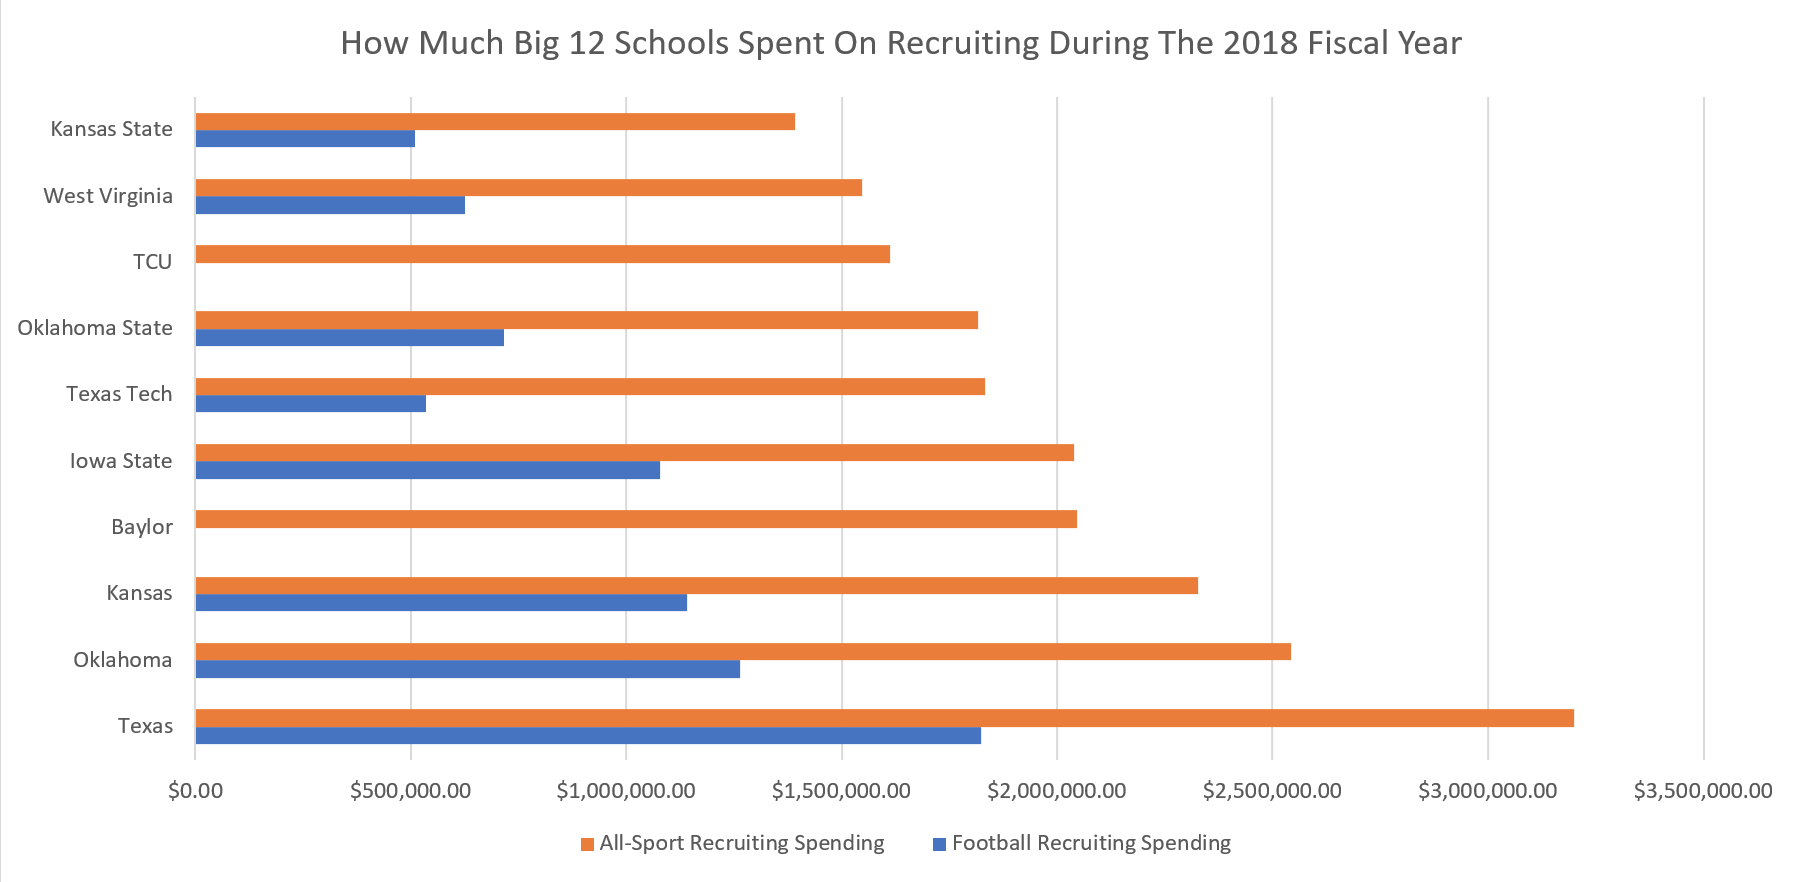
Football recruiting data for Baylor and TCU is unavailable since they are private institutions.
Big Ten
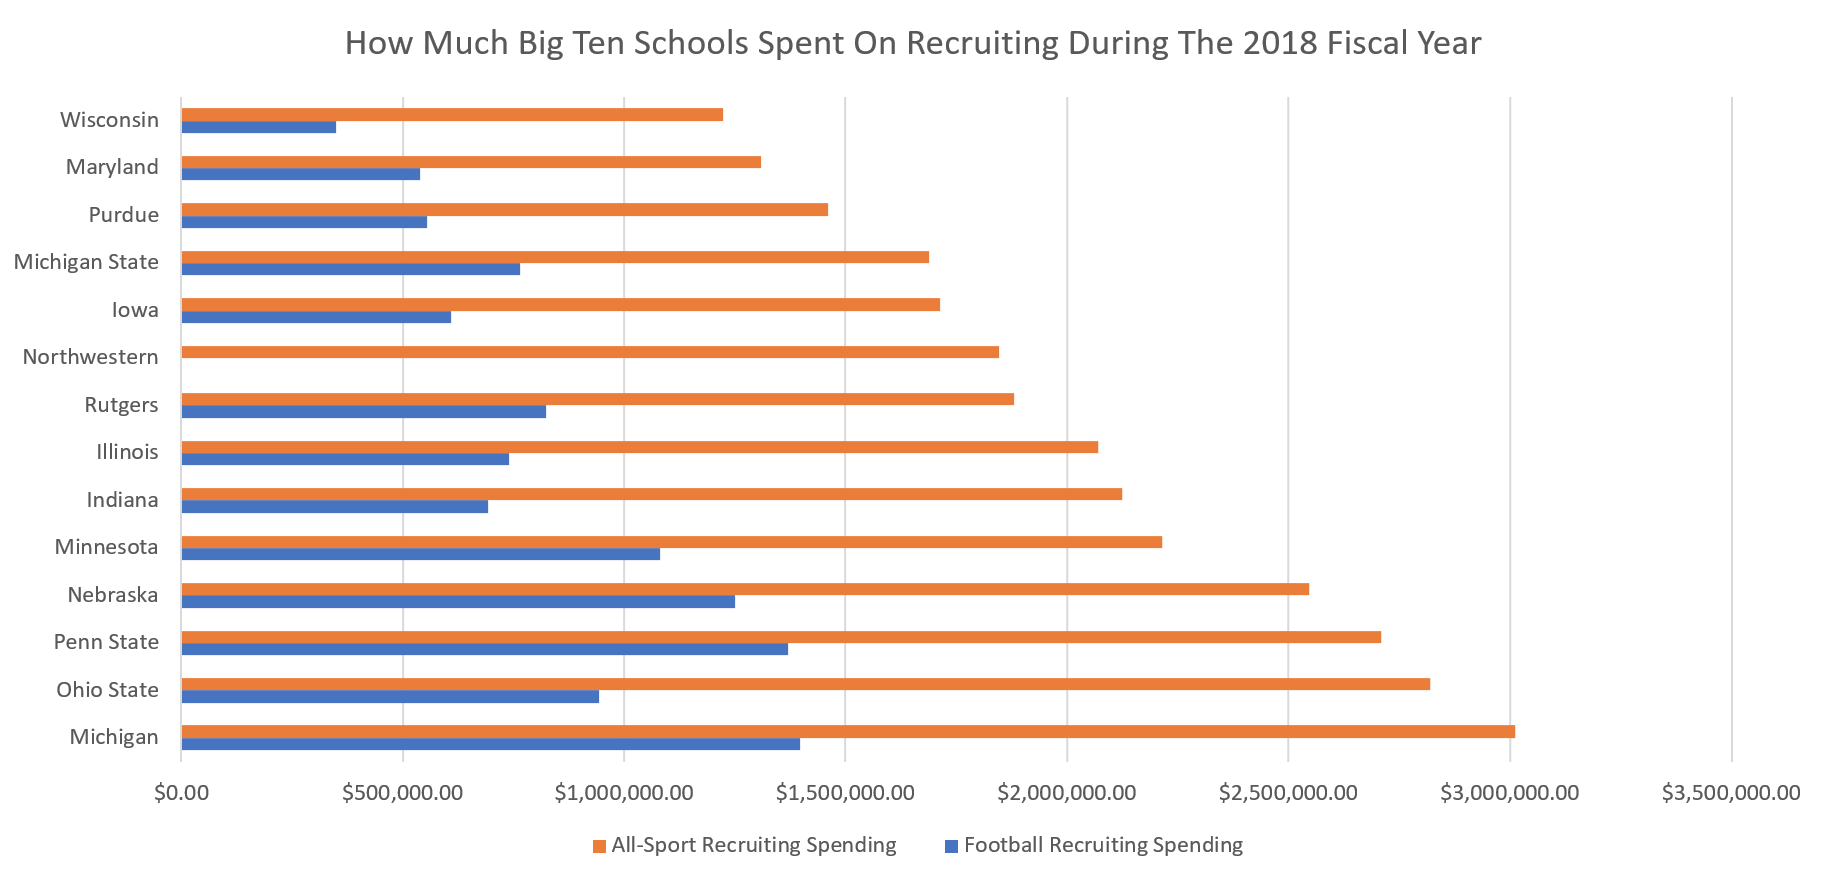
Football recruiting data for Northwestern is unavailable since it’s a private institution.
Pac-12
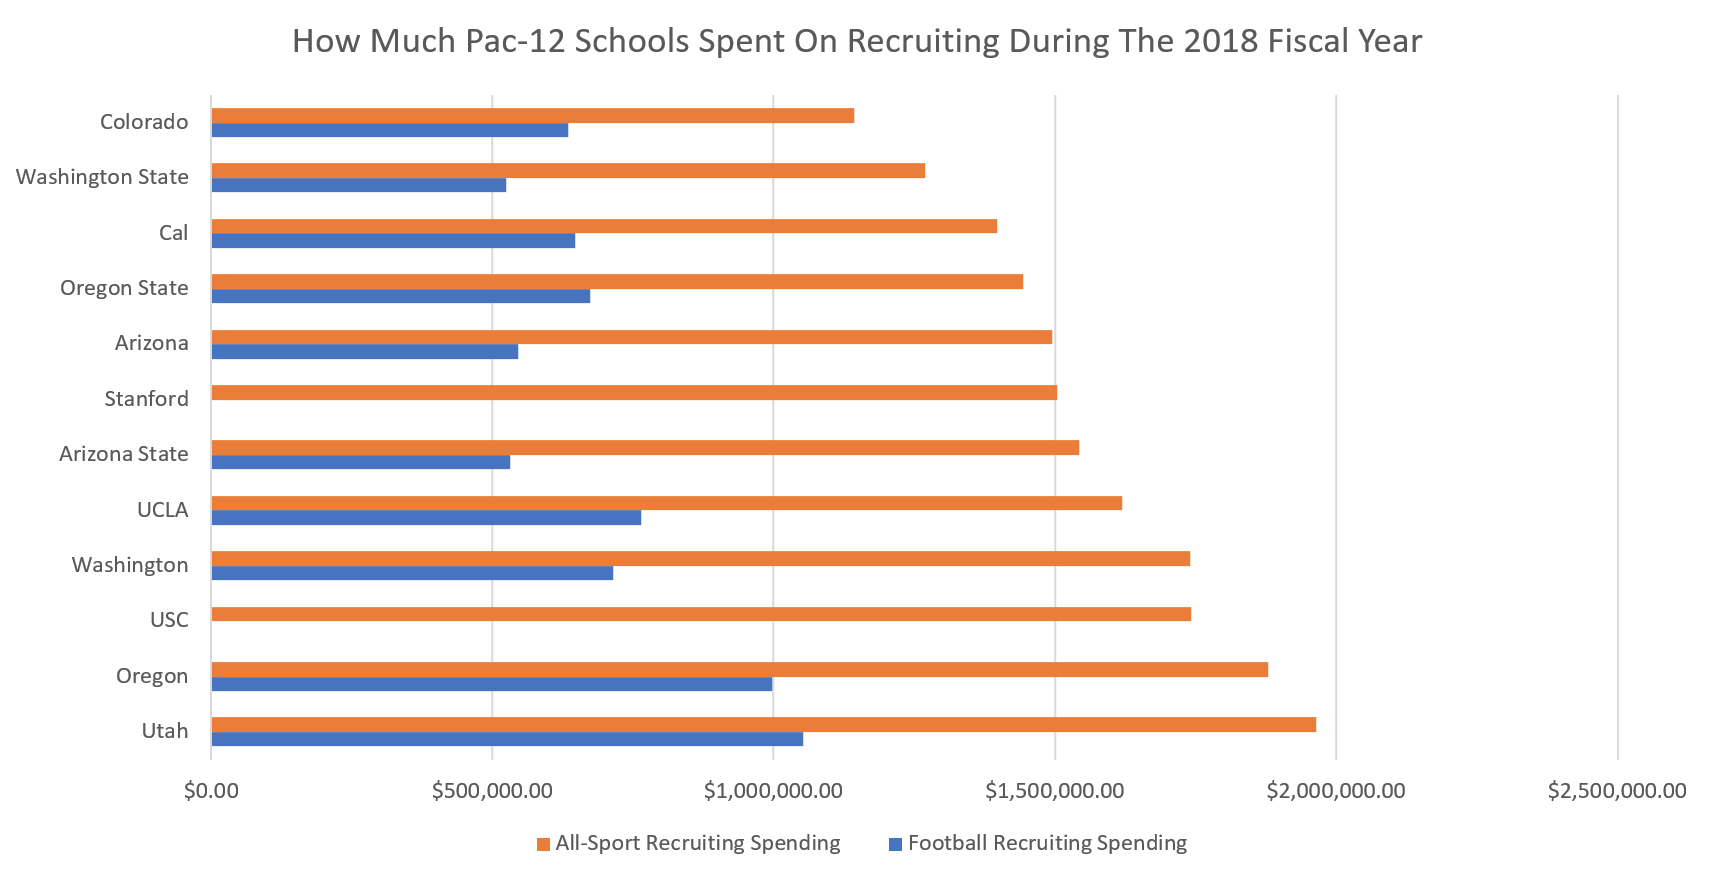
Football recruiting data for Stanford and USC is unavailable since they are private institutions.
SEC

Football recruiting data for Alabama, Auburn, Arkansas and Tennessee is unavailable since public records requests in those states are limited to residents. Data for Vanderbilt is unavailable since it’s a private institution.
Where does the money go?
You might be wondering what types of expenses schools incur when they assemble a 20-some-player recruiting class through the work of the head coach, 10 assistant coaches and behind-the-scenes, on-campus recruiting personnel.
Stadium obtained an itemized list of LSU and Oregon’s football recruiting-related expenses from the 2018 calendar year to find the answers.
(Note: This data is different from the fiscal year numbers from the universities’ NCAA Financial Reports.)
The charts below show the types of expenses (as defined by the universities) and expense amounts for a pair of major Power Five programs that invest heavily in football recruiting.
LSU
| Category | Expenses |
| Special Recruiting Meals | $149,628.16 |
| Airfare | $140,322.20 |
| Other Rentals | $92,713.78 |
| Publications/Subscriptions | $85,289.90 |
| Lodging | $57,144.17 |
| Other Specialty Services | $54,600.00 |
| Potential Student-Athlete Airfare | $48,777.50 |
| Software Subscriptions and Licenses | $45,991.90 |
| Rental Cars | $37,939.95 |
| Charter Bus Rental | $20,880.00 |
| Potential Student-Athlete Lodging | $20,103.00 |
| Per Diems | $17,813.00 |
| Other Supplies | $15,229.92 |
| Miscellaneous for Potential Student-Athletes | $11,398.57 |
| Advertising | $10,000.00 |
| Printing, Binding and Duplication | $7,718.39 |
| Potential Student-Athlete Mileage | $6,809.00 |
| Shuttles and Taxis | $6,562.03 |
| Mileage | $5,705.32 |
| Non-Employee/Guest Travel | $6,450.50 |
| Gas for Rental Cars | $4,885.93 |
| Promotional Supplies | $4,452.34 |
| Salaries and Wages (Wages as Earned) | $7,200.00 |
| Envelopes | $2,860.00 |
| Parking | $2,818.34 |
| Office Products and Supplies | $2,639.26 |
| Single-Day Meals | $2,609.00 |
| Postage and Stamps | $2,607.49 |
| Sports and Recreational Supplies | $2,034.24 |
| Miscellaneous Travel Expenses | $1,931.39 |
| Audio/Visual Concert Equipment Rentals | $1,800.00 |
| Salaries and Wages (Professional & Academic – Extra Compensation) | $2,400.00 |
| Other Operating Services – Miscellaneous | $1,197.50 |
| Fringe Benefits Expense | $1,618.82 |
| Baggage Fees | $375.00 |
| Tolls | $135.46 |
| Special Meal – Business Meeting/Event | $52.00 |
| Event Admission | $28.00 |
| Tips | $5.00 |
| TOTAL | $882,727.06 |
Oregon
| Category | Expense Amount |
| Air Travel | $272,580.03 |
| Hosting Groups & Guests | $228,725.77 |
| Lodging | $171,040.87 |
| Software Subscriptions/Licensing Services | $96,520.00 |
| Ground Transportation | $85,914.45 |
| Shuttle Service | $49,085.22 |
| Fees & Services | $42,224.09 |
| Professional Photography Services | $29,882.81 |
| Non-IT Equipment Rentals | $27,949.29 |
| Cell Phone | $22,118.80 |
| Procurement Card Purchases | $19,130.62 |
| Per Diems | $18,887.50 |
| Int Exp Internal Bank Earnings Dist | $12,162.54 |
| Duplicating & Copying | $11,300.76 |
| Reimbursement S&S Exp to Employee | $7,527.08 |
| Athletic Supplies | $7,427.88 |
| Performance Fees | $6,450.00 |
| Computer and IT Peripherals <$5,000 | $6,266.75 |
| Printing & Publishing | $4,217.15 |
| Selling & Marketing Costs | $3,996.00 |
| Minor Equipment (under $5,000/unit) | $3,956.97 |
| Miscellaneous Supplies | $3,808.22 |
| Automotive Fuel | $3,285.90 |
| Maintenance Materials | $3,032.00 |
| Telecom Recurring Charges | $2,490.00 |
| Postage | $2,187.04 |
| Miscellaneous Fees & Services | $1,907.25 |
| Student Pay | $1,868.83 |
| Student Meals | $1,851.80 |
| Temporary Employees Pay | $1,230.00 |
| Overtime | $1,053.19 |
| Office & Administrative Supplies | $540.52 |
| Miscellaneous Travel | $467.34 |
| Audio/Video Equipment and Supplies | $442.64 |
| Express Mail | $429.60 |
| Photography Supplies | $319.96 |
| Software License | $298.99 |
| Books Publication & Other Reference Materials | $282.29 |
| Event Services | $162.00 |
| Overtime Meal Allowance | $65.00 |
| Miscellaneous Rentals | $60.00 |
| Non-Employee Travel | $20.00 |
| Credit Card Discounts | $8.79 |
| Dues & Memberships | $5.00 |
| TOTAL | $1,153,180.94 |
Upward trajectory in spending
Florida State’s recruiting budget increased by 8.69 percent to $1,718,898 for the 2018-19 fiscal year compared to its recruiting spending of $1,581,347 from the 2017-18 fiscal year.
If the university’s football recruiting budget continues to increase at that rate, the Seminoles will spend more than $2 million annually on football recruiting during the 2020-21 fiscal year.
That upward trajectory isn’t unique to FSU.
Georgia, which landed the No. 1 recruiting class last year, spent $2.6 million on recruiting during the 2018 fiscal year and for a program that nearly won the 2018 College Football Playoff National Championship and has gone toe-to-toe with Alabama in each of the last two seasons, it was arguably worth every penny.
And if you look closer at another SEC contender, you see that since the start of the 2011 fiscal year, LSU’s spending on football recruiting has more than quadrupled, which is outlined in the chart below that shows data from the Tigers’ last 15 NCAA Financial Reports.
| Fiscal Year | LSU Football’s Recruiting Spending | LSU’s Recruiting Class Ranking |
| 2004 | $413,955 | 4th |
| 2005 | $378,256 | 14th |
| 2006 | $320,774 | 8th |
| 2007 | $352,720 | 5th |
| 2008 | $425,712 | 13th |
| 2009 | $427,833 | 1st |
| 2010 | $450,649 | 9th |
| 2011 | $302,882 | 8th |
| 2012 | $382,717 | 13th |
| 2013 | $577,442 | 6th |
| 2014 | $523,543 | 2nd |
| 2015 | $822,294 | 5th |
| 2016 | $821,042 | 2nd |
| 2017 | $866,544 | 7th |
| 2018 | $1,287,344 | 15th |
As shown by the “Recruiting Class Ranking” column, LSU is essentially a lock to enroll a top-15 recruiting class in the modern era of college football, according to the 247Sports Composite rankings.
In addition to being the flagship school in the talent-rich state of Louisiana with recruiting hotbeds like Texas, Florida and Mississippi nearby, LSU can sell its annual appearances in bowl games, plus relatively recent conference and national championships.
During the lifetime of 2020’s top recruits, the Tigers are one of the six most accomplished college football programs and second among SEC schools, behind only the juggernaut that its former coach, Nick Saban, has built at Alabama.
LSU has won at least eight games in every season this century, and while an 8-4 regular season won’t cut it in Baton Rouge, that’s a pretty stable floor for a program that has proven capable of winning 12 or 13 games a year.
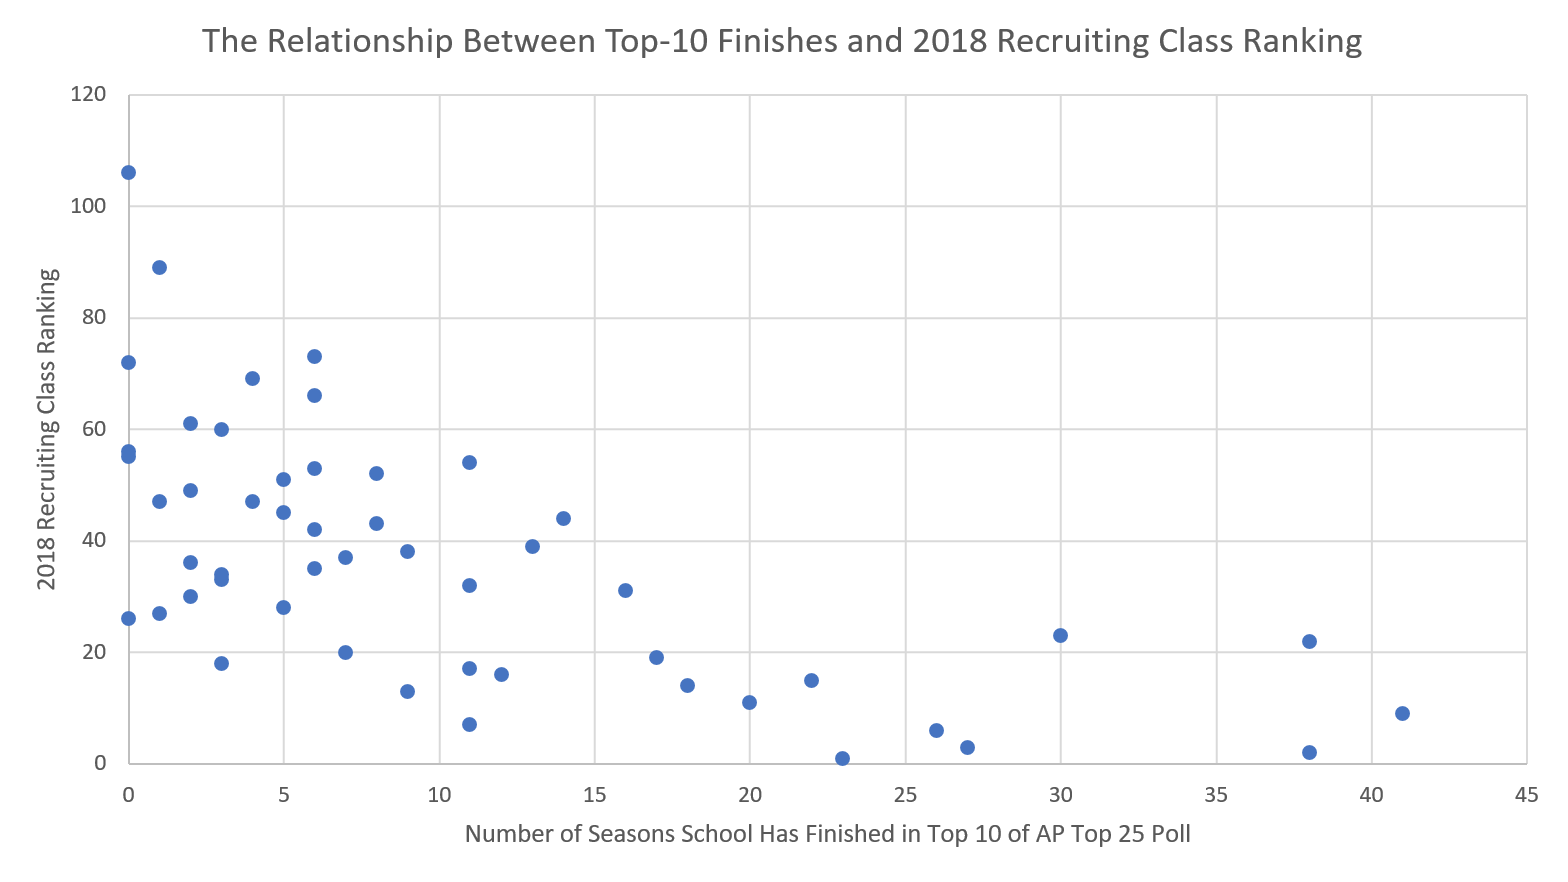
The Tigers have finished in the top 10 of the AP Top 25 Poll on 22 occasions – a number that’s only bested by Oklahoma (42), Ohio State (38), Michigan (38), Nebraska (30), Texas (27), Penn State (26) and Georgia (23) among the schools examined.
Each of those schools enrolled a top-25 recruiting class in 2018, including five in the top 10.
That speaks to the relationship between the number of times a school has finished a season ranked in the top 10 and its 2018 recruiting class ranking — our attempt to measure the impact that selling points like “history” or “tradition” have on the recruiting trail in the present day.
Here’s a graph showing that relationship.
However, unlike some of its counterparts mentioned above, LSU has also shown more consistency and high-level success in the last two decades.
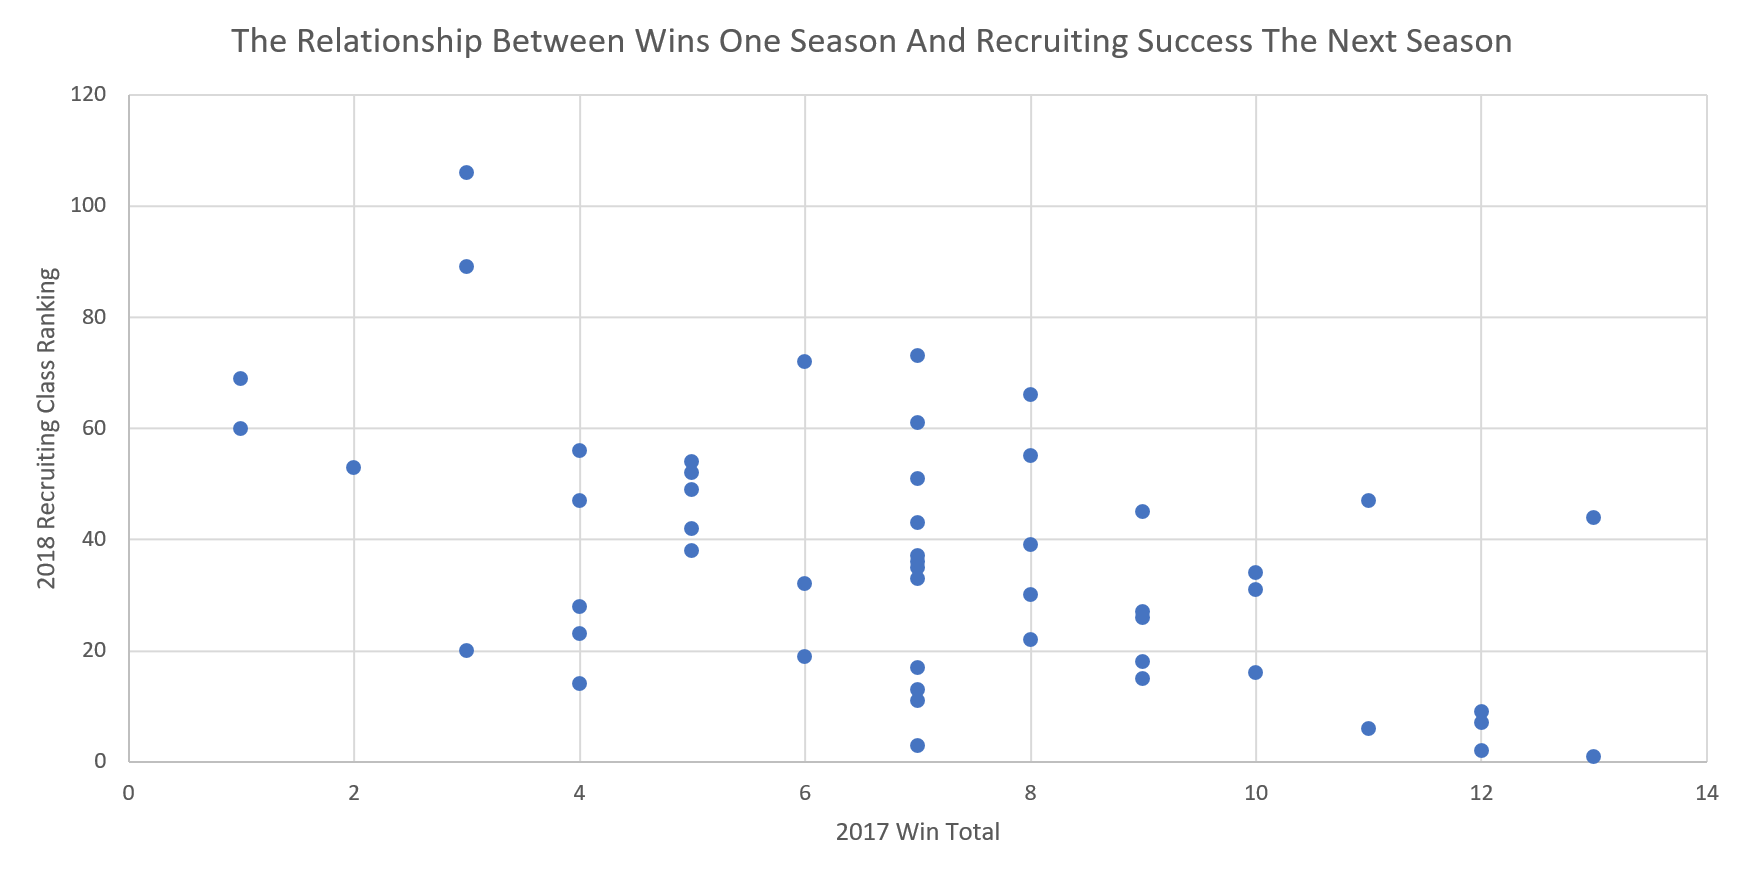
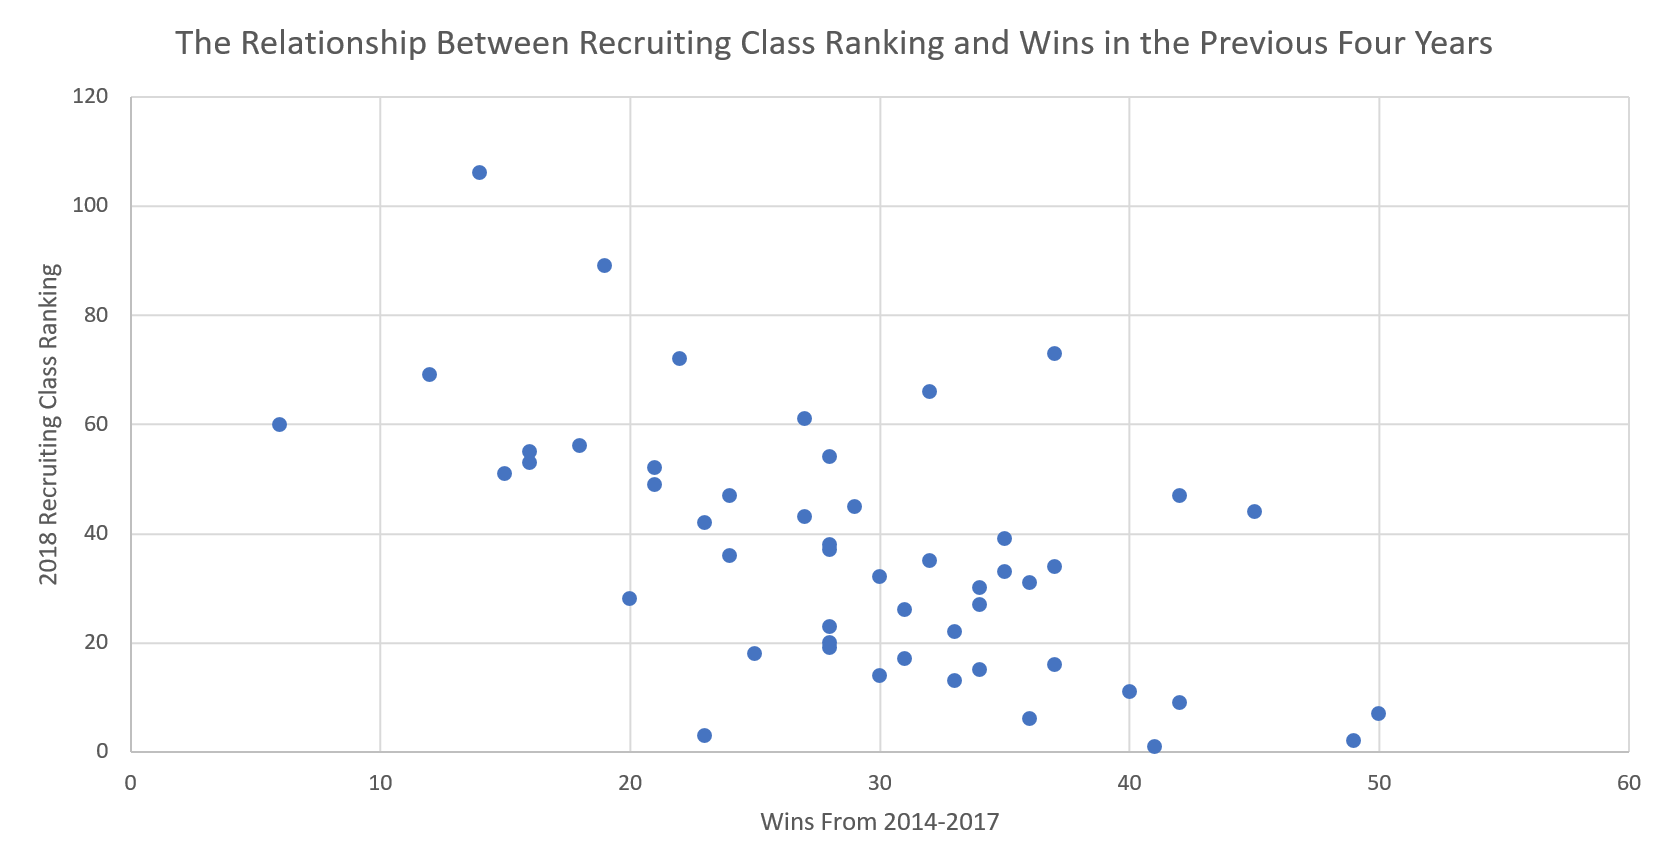
The following scatter plots show the relationships between:
- A school’s 2018 recruiting class ranking and its win total in the previous season
- A school’s 2018 recruiting class ranking and its win total in the previous four seasons
- A school’s 2018 recruiting class ranking and its final Football Outsiders S&P+ rating from 2017*
*The S&P+ ratings are a national, 1-to-130 ranking system based upon analysis of play-by-play and drive data from every college football game each season.
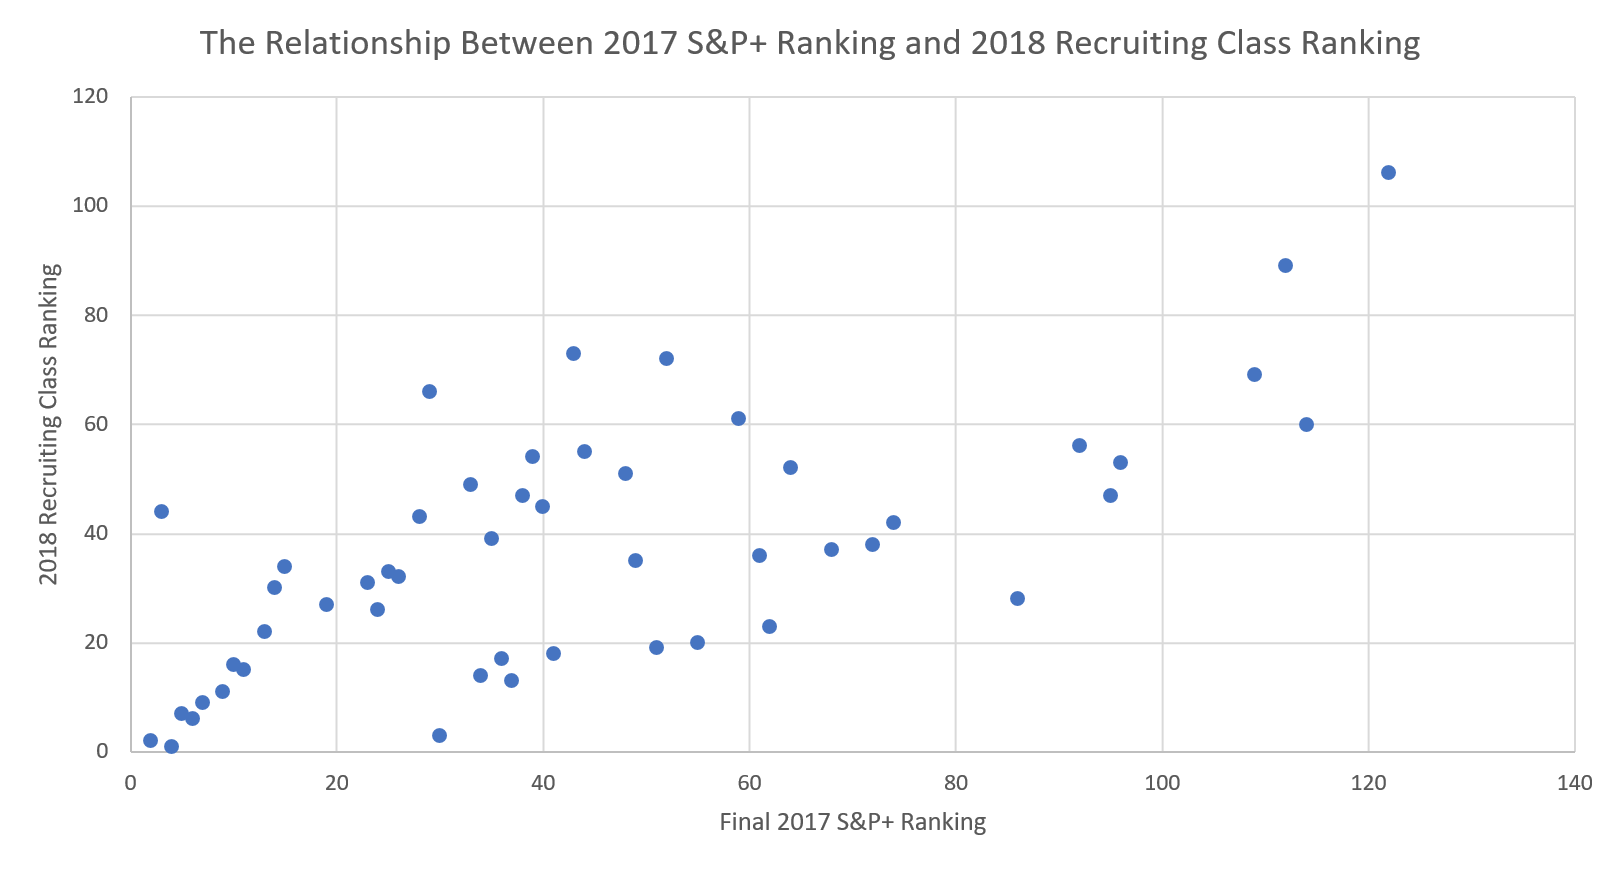
What does it all mean?
After analyzing annual million-dollar investments into recruiting, recent win totals and historical AP polls, we’re left with a recipe that tells us the surest way to land an elite recruiting class is to:
1.) invest at least $750,000 annually (but more likely at least $1.2 million) in recruiting,
2.) field a football team that has recently experienced high-level success, and
3.) be able to boast about your program’s proven winning culture.
2.) field a football team that has recently experienced high-level success, and
3.) be able to boast about your program’s proven winning culture.
But how many schools can check all three boxes?
Among the schools examined, 20 of the 51 programs have finished in the top 10 of the AP poll in five or fewer seasons all time, while just six schools have had a top-10 finish at least 25 times.
Most schools don’t have the history of Oklahoma, Ohio State or Texas.
That raises an interesting “chicken-or-the-egg”-type question: Is there a strong enough correlation between a school’s recruiting budget and recruiting class ranking that suggests college football programs could potentially funnel large sums of money into their recruiting and receive an immediate payoff by building a more talented roster full of 4- and 5-star recruits?
Or do schools first need to win at a high level to show blue-chip recruits (and university officials, fans and boosters) that it’s possible to win 10-plus games and challenge for conference championships consistently?
In other words, can an increased recruiting budget act as a shortcut to assembling a more talented roster in the future even if a school’s on-field results, recruiting footprint and/or program history don’t align with the profile of programs that typically land a ton of 4- and 5-star recruits?
Increased funding could lead to more private flights, allowing a team’s coaching staff to expand its recruiting footprint, evaluate more players and see prospects more often.
Sure, you’d have to make a significant financial investment to assemble an elite recruiting class, but does that mean that if a team like Rutgers spent $2 million annually on recruiting, would the Scarlet Knights consistently enroll top-10 recruiting classes?
Or would the inverse be true that if Clemson’s recruiting budget was slashed to one-third of its current value and its football program only had $600,000 to work with per year to land the next wave of Tigers, would they only land a handful of blue-chip recruits?
Our immediate gut reaction to both of those questions was “No,” and it’s probably yours, too.
But those questions raise a theoretical high-risk, high-reward investment that would be fascinating to watch play out in real time as schools are currently spending more money than ever before on recruiting, and as the conversation about future College Football Playoff expansion escalates, more programs could enter the national title race in the near future.
No comments:
Post a Comment