Saturday, May 25, 2024

Where ACC Students Come From


Where ACC Students Come From (2023)

Mostly In-State:

FSU 84.8%

UNC 83.4%

NC State 82.6%

Cal 77.7%

Louisville 72.7%

VT 63.9%

UVA 61.8%

GT 56.4%

Pitt 54.1%

Clemson 52.4%

The vast majority of the students at FSU, UNC, NC State and Cal are from in-state.

For GT, Pitt, and Clemson, it's slightly more than half.

Mostly Out-of-State:

Notre Dame 93.7%

Duke 88.4%

Wake 86.1%

BC 78.8%

Miami 76.5%

Syracuse 71.9%

Stanford 65.5%

SMU 61.8%

A mere 6.3% of Notre Dame's students come from Indiana. Wow! Duke and Wake are in the high 80% in terms of out-of-state students, too.

Conclusions:

For the most part, public schools tend to have higher percentage of in-state students, while private schools tend to attract more out-of-state students.

FSU Softball draws high TV ratings


Friday, May 24, 2024

FSU Women's Soccer wins 4th National Title


Saturday, April 20, 2024

FSU & ESPN leaving FSU out...

https://247sports.com/college/florida-state/board/36/Contents/espn-graphic-228601790/?page=1


is good at leaving us out

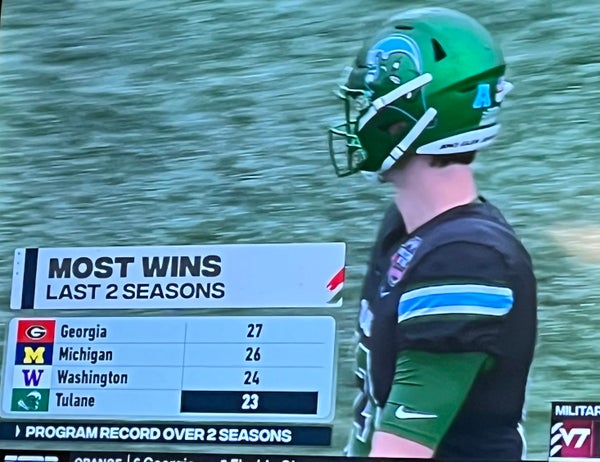
FSU was at 23 & tied for #1 in current longest win streak right with Washington


"This is a major pet peeve of mine. I was watching the ACC Huddle schedule reveal show today and they flashed the attached graphic when discussing FSU and Clemson. I don't understand how a league filled with premiere academic institutions continues to show this graphic which creates a false narrative. Clemson has only won 8 ACC Championships and 2 national titles since FSU joined the ACC."

Tuesday, April 16, 2024

CFB Blue Blood Update

 College Football Blue Bloods: Ranking The 25 Best Football Schools


College Football Blue Bloods

To be here among the elite of the elite football schools, you need at least 20 seasons with ten wins or more.

12 Tennessee

10-Win Football Seasons: 20
SEC, 2 National Titles

11 Notre Dame

10-Win Football Seasons: 23
ACC, 12 National Titles

10 Texas

10-Win Football Seasons: 25
SEC, 4 National Titles

9 Penn State

10-Win Football Seasons: 26
Big Ten, 4 National Titles

8 Florida State

10-Win Football Seasons: 26
ACC, 3 National Titles

7 USC

10-Win Football Seasons: 28
Big Ten, 9 National Titles

6 Nebraska

10-Win Football Seasons: 28
Big Ten, 5 National Titles

5 Georgia

10-Win Football Seasons: 28
SEC, 3 National Titles

4 Ohio State

10-Win Football Seasons: 31
Big Ten, 6 National Titles

3 Michigan

10-Win Football Seasons: 32
Big Ten, 10 National Titles

2 Oklahoma

10-Win Football Seasons: 42
SEC, 7 National Titles

1 Alabama

10-Win Football Seasons: 44
SEC, 15 National Titles


https://allthingsfsu.blogspot.com/2022/02/all-time-wins-vs-bluebloods-updated.html

https://allthingsfsu.blogspot.com/2017/01/football-bluebloods.html

https://allthingsfsu.blogspot.com/2017/05/2017-update-kings-barons-knights-and.html

https://allthingsfsu.blogspot.com/2023/07/calculating-top-50-blue-bloods.html

https://allthingsfsu.blogspot.com/2022/07/2022-kings-and-barons.html

https://allthingsfsu.blogspot.com/2017/05/cfb-bluebloods.html


Monday, April 15, 2024

2022-2023 Gross Revenue Totals by Conference for the P5 (Totals and Averages)


2022-2023 Gross Revenue Totals by Conference for the P5 (Totals and Averages)

SEC:
5. Georgia: $210,108,069
9. Louisiana State: $200,476,979
11. Texas A&M: $194,254,820
12. Auburn: $192,658,903
13. Tennessee: $191,271,254
14. Alabama: $191,190,486
18. Florida: $176,795,879
19. Arkansas: $170,990,473
22. Kentucky: $166,423,002
23. South Carolina: $160,420,147
36. Mississippi: $136,764,296
48. Vanderbilt: $125,133,666
49. Missouri: $124,293,939
57. Mississippi State: $115,664,788
Total Revenue: $2,356,446,701
Average Per School: $168,317,621.50
UP from 2021-22 $13,142,075


B1G:
2. Ohio State: $249,698,974
6. Michigan: $206,514,688
7. Penn State: $201,533,972
10. Nebraska: $197,009,548
15. Wisconsin: $190,564,690
21. Iowa: $166,886,577
30. Michigan State: $149,254,610
31. Indiana: $143,221,485
38. Minnesota: $136,614,891
41. Illinois: $134,767,269
44. Rutgers: $130,221,793
50. Purdue: $124,290,313
53. Maryland: $121,183,392
56. Northwestern: $117,587,514
Total Revenue: $2,268,945,594
Average Per School: $162,067,542.43
Up from 2021-22 $12,261,620


ACC:
3. Notre Dame: $224,191,928* (Total not included with ACC)
20: Florida State: $170,434,508
24. Miami: $159,633,958
25. Louisville: $155,191,814
27. Duke: $152,509,818
28. Clemson: $152,093,316
34. North Carolina: $137,918,817
37. Pittsburgh: $136,704,076
45. Virginia Tech: $129,705,818
47. Virginia: $125,968,540
52. N.C. State: $121,444,506
55. Boston College: $118,430,392
58. Georgia Tech: $115,654,077
59. Syracuse: $113,510,249
64. Wake Forest: $97,298,475
Total Revenue: $1,886,498,364
Average Per School: $134,749,883.14
Up from 2021-22 $13,057,491


Big 12:
1. Texas: $261,353,404
7. Kansas: $205,747,275
16. Oklahoma: $183,919,881
29. Texas Christian: $149,297,918
35. Baylor: $137,460,582
51. Texas Tech: $123,551,688
54. Oklahoma State: $119,235,776
61. West Virginia: $103,142,400
62. Kansas State: $102,332,761
65. Iowa State: $93,048,114
Total Revenue: $1,479,089,799
Average Per School: $147,908,979.9
Up from 2021-22 $19,676,572 (mostly due to Kansas)


PAC 12:
4. Southern California: $212,013,703
17. Stanford: $179,645,688
26. Washington: $154,849,477
32. California Los Angeles: $141,964,728
33. Arizona: $138,761,638
39. Colorado: $136,114,468
40. California: $134,872,865
43. Oregon: $132,359,145
46. Arizona State: $128,265,591
60. Utah: $111,483,459
63. Oregon State: $97,792,784
66. Washington State: $79,015,052
Total Revenue: $1,647,138,598
Average Per School: $137,261,549.83
Up from 2021-22 $16,262,933


Brigham Young: $106,430,702
Central Florida: $88,199,644
Southern Methodist: $86,044,162
Houston: $84,023,065
Cincinnati: $77,436,016

FSU Quantum Science Investment