Gym College... 1955 Short Documentary on FSU Men's Gymnastics
5-year Average Attendance Numbers
# School 5 Year Average
1 Michigan 110,235
2 Penn State 106,750
3 Ohio State 102,108
4 Texas A&M 100,156
5 Alabama 100,091
6 LSU 99,561
7 Texas 97,565
8 Tennessee 93,936
9 Georgia 92,760
10 Nebraska 87,599
11 Auburn 85,924
12 Florida 85,791
13 Oklahoma 83,073
14 Clemson 80,557
15 Notre Dame 76,108
16 Wisconsin 75,328
17 South Carolina 74,988
18 Michigan State 69,959
19 Iowa 67,775
20 Washington 66,220
21 Florida State* 65,390
22 Arkansas 62,914
23 Virginia Tech 61,137
24 USC 60,316
25 BYU 59,058
26 Iowa State 58,847
27 Ole Miss 57,337
28 Kentucky 57,155
29 NC State 56,137
30 Purdue 55,370
31 Texas Tech 54,643
32 Mississippi State 54,402
33 Oklahoma State 53,999
34 Oregon 53,384
35 Missouri 53,367
36 West Virginia 52,892
37 Miami (FL) 52,535
38 Utah 49,833
39 Kansas State 49,609
40 North Carolina 48,019
41 Colorado 47,579
42 Louisville 47,415
43 Arizona State 47,262
44 Pittsburgh 46,653
45 UCLA 46,075
46 Minnesota 44,743
47 Indiana 44,126
48 Baylor 44,087
49 TCU 43,834
50 Virginia 42,796
51 UCF 42,758
52 Rutgers 42,504
53 Arizona 42,279
54 Illinois 40,166
55 California 39,992
56 Georgia Tech 39,223
57 Syracuse 37,308
58 Maryland 36,345
59 Cincinnati 36,030
60 Boston College 35,734
61 ECU 35,373
62 Fresno State 35,095
63 Stanford 34,746
HOW BIG IS YOURS? 🤔
— Tony Altimore (@TJAltimore) November 17, 2024
Avg. Football Attendance, through 17 Nov
Lots of interesting nuggets in the latest attendance data, especially for teams having unexpected seasons!
Here's the update, including yesterday: ⤵️
Which surprises stand out?
...besides my fav retro logo? 😜 pic.twitter.com/32Dx4gNpdD
Lifted from the main board, I assume they are accurate:
2024: 6m, 4th out of 4 P4 Conferences
2023: 7.03m, 5th out of 5
2022: 3.47m, 5th of 5
2021: 2.66m, 6th (also behind AAC CCG)
2020: no CCGs
2019: 3.97m, 5th out of 5
2018: 4.2m 4th out of 5, .2m ahead of the Pac CCG
This is from sports media watch: https://www.sportsmediawatch.com/2019/12...c-clemson/
2019 4.0m
2018 4.2m
2017 5.4m
2016 5.3m
2015 7.9m
2014 10.1m
2013 5.7m
2012 2.0m
2011 2.8m
2010 3.0m
2009 2.5m
Most Wins - Last 50 Years
— Pick Six Previews (@PickSixPreviews) January 28, 2025
(1975-2024)
481- Ohio State
465- Oklahoma
462- Alabama
459- Georgia
445- Michigan
441- Penn State
439- Nebraska
436- Florida State
435- BYU
434- Clemson
419- Florida
417- Texas
414- Miami
405- USC
401- LSU

Elite article by ACC FOOTBALL RX and National Title Games, 1985-2023 ratings
Here are the TV ratings for all college football national championship games from January 1986 to January 2023:
| SEASON | DATE | BOWL | GAME | NET | RATING | Vwrs(M) | |
| 2022-23 | Mon, 1/9/23 | CFP | UGA | TCU | ESPN | 8.7 | 17.223 |
| 2021-22 | Mon, 1/10/22 | CFP | UGA | Ala | ESPN | 12.1 | 22.563 |
| 2020-21 | Mon, 1/11/21 | CFP | Ala | OSU | ESPN | 10.3 | 18.653 |
| 2019-20 | Mon, 1/13/20 | CFP | LSU | Clem | ESPN | 14.3 | 25.588 |
| 2018-19 | Mon, 1/7/19 | CFP | Clem | Ala | ESPN | 13.8 | 25.28 |
| 2017-18 | Mon, 1/8/18 | CFP | Ala | UGA | ESPN | 15.6 | 28.443 |
| 2016-17 | Mon, 1/9/17 | CFP | Clem | Ala | ESPN | 14.2 | 25.266 |
| 2015-16 | Mon, 1/11/16 | CFP | Ala | Clem | ESPN | 15.0 | 26.182 |
| 2014-15 | Mon, 1/12/15 | CFP | OSU | Ore | ESPN | 18.6 | 34.148 |
| SEASON | DATE | BOWL | GAME | NET | RATING | Vwrs(M) | |
| 2013-14 | Mon., 1/6/14 | BCS | FSU | Aub | ESPN | 14.8 | 26.205 |
| 2012-13 | Mon., 1/7/13 | BCS | Ala | ND | ESPN | 15.1 | 26.38 |
| 2011-12 | Mon., 1/9/12 | BCS | Ala | LSU | ESPN | 14.0 | 24.214 |
| 2010-11 | Mon., 1/10/11 | BCS | Aub | Ore | ESPN | 15.3 | 27.316 |
| 2009-10 | Thu., 1/7/10 | BCS | Ala | Tex | ABC | 17.2 | 30.776 |
| 2008-09 | Thu., 1/8/10 | BCS | Fla | OU | FOX | 15.8 | 26.767 |
| 2009-10 | Thu., 1/7/10 | BCS | ALA 37 | TEX 21 | ABC | 17.2 | 30.776 |
| 2008-09 | Thu., 1/8/09 | BCS | UF 24 | OK 14 | FOX | 15.8 | 26.767 |
| 2007-08 | Tue., 1/7/08 | BCS | LSU 38 | OSU 24 | FOX | 14.4 | 23.069 |
| 2006-07 | Mon., 1/8/07 | BCS | UF 41 | OSU 14 | FOX | 17.4 | 28.795 |
| SEASON | DATE | BOWL | GAME | NET | RATING | Vwrs(M) | |
| 2005-06 | Wed., 1/4/06 | Rose | TEX 41 | USC 38 | ABC | 21.7 | 35.630 |
| 2004-05 | Tue., 1/4/05 | Orange | USC 55 | OK 19 | ABC | 13.7 | 21.419 |
| 2003-04 | Sun., 1/4/04 | Sugar | LSU 21 | OK 14 | ABC | 14.8 | 23.937 |
| Thu., 1/1/04 | Rose | USC 28 | MICH 14 | ABC | 14.3 | 23.871 | |
| 2002-03 | Fri., 1/3/03 | Fiesta | OSU 31 | MIA 24 | ABC | 17.2 | 29.104 |
| 2001-02 | Thu., 1/3/02 | Rose | MIA 37 | NEB 14 | ABC | 13.8 | 21.559 |
| 2000-01 | Wed., 1/3/01 | Orange | OK 13 | FSU 2 | ABC | 17.8 | 27.240 |
| 1999-00 | Tue., 1/4/00 | Sugar | FSU 46 | VT 29 | ABC | 17.5 | 26.962 |
| 1998-99 | Mon., 1/4/99 | Fiesta | TEN 23 | FSU 16 | ABC | 17.2 | 26.112 |
| SEASON | DATE | BOWL | GAME | NET | RATING | Vwrs(M) | |
| 1997-98 | Fri., 1/2/98 | Orange | NEB 42 | TEN 17 | CBS | 13.3 | n/a |
| Thu., 1/1/98 | Rose | MICH 21 | WSU 16 | ABC | 17.6 | n/a | |
| 1996-97 | Thu., 1/2/97 | Sugar | UF 52 | FSU 20 | ABC | 17.9 | n/a |
| 1995-96 | Tue., 1/2/96 | Fiesta | NEB 62 | UF 24 | CBS | 18.8 | n/a |
| 1994-95 | Sun., 1/1/95 | Orange | NEB 24 | MIA 17 | NBC | 11.4 | n/a |
| 1993-94 | Sat., 1/1/94 | Orange | FSU 18 | NEB 16 | NBC | 17.8 | n/a |
| 1992-93 | Fri., 1/1/93 | Sugar | ALA 34 | MIA 13 | ABC | 18.2 | n/a |
| 1991-92 | Wed., 1/1/92 | Rose | WSH 34 | MICH 14 | ABC | 15.4 | n/a |
| Orange | MIA 22 | NEB 0 | NBC | 11.0 | n/a | ||
| 1990-91 | Tue., 1/1/91 | Orange | COL 10 | ND 9 | NBC | 18.3 | n/a |
| Citrus | GT 45 | NEB 21 | ABC | 9.7 | n/a | ||
| 1989-90 | Mon., 1/1/90 | Sugar | MIA 33 | ALA 25 | ABC | 7.4 | n/a |
| 1988-89 | Mon., 1/2/89 | Fiesta | ND 34 | WVU 21 | NBC | 17.0 | n/a |
| 1987-88 | Fri., 1/1/88 | Orange | MIA 20 | OK 14 | NBC | 20.8 | n/a |
| 1986-87 | Mon., 1/2/87 | Fiesta | PSU 14 | MIA 10 | NBC | 24.9 | n/a |
| 1985-86 | Wed., 1/1/86 | Orange | OK 25 | PSU 10 | NBC | 21.3 | n/a |
Most wins in a single bowl game WITHOUT a loss 📈 pic.twitter.com/ZWbYfWlb4q
— CFB Tracker (@MatchupTracker) January 24, 2025
https://t.co/2uX0jUQHZY pic.twitter.com/OZ5fcHm5IH
— Big Ten information. College football fan (@Genetics56) January 21, 2025
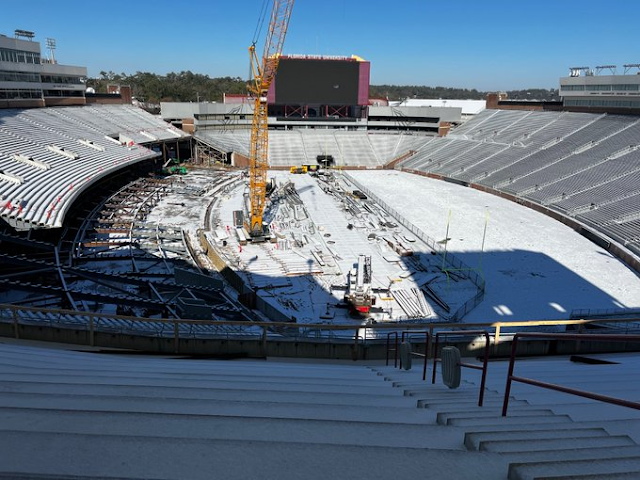
Good morning from Florida State University! ❄ pic.twitter.com/505NhViZHK
— Florida State University (@FloridaState) January 22, 2025

Drone tour from Tallahassee! via @tropicalupdate pic.twitter.com/XFmHNaZlwQ
— Warchant.com (@Warchant) January 22, 2025


What the top 75 college sports programs are worth
In aggregate, the SEC is worth roughly $13.3 billion, an average of about $832 million per school; followed by the Big Ten at about $13.2 billion, an average of roughly $734 million per school; the ACC at roughly $10 billion, or about $558 million per school; and the Big 12, at roughly $6.7 billion, or about $420 million per school.
| Rank | Program | Valuation | Revenue | Conference | City | Public/Private |
| 1. | Ohio State University | $1.32B | $280M | Big Ten | Columbus, OH | public |
| 2. | University of Texas at Austin | $1.28B | $271M | SEC | Austin, TX | public |
| 3. | Texas A&M University | $1.26B | $279M | SEC | College Station, TX | public |
| 4. | University of Michigan | $1.06B | $230M | Big Ten | Ann Arbor, MI | public |
| 5. | University of Alabama | $978M | $200M | SEC | Tuscaloosa, AL | public |
| 6. | University of Notre Dame | $969M | $224M | ACC | Notre Dame, IN | private |
| 7. | University of Georgia | $950M | $210M | SEC | Athens, GA | public |
| 8. | University of Nebraska | $943M | $205M | Big Ten | Lincoln, NE | public |
| 9. | University of Tennessee | $940M | $202M | SEC | Knoxville, TN | public |
| 10. | University of Oklahoma | $928M | $199M | SEC | Norman, OK | public |
| 11. | Penn State University | $924M | $202M | Big Ten | University Park, PA | public |
| 12. | University of Southern California | $923M | $212M | Big Ten | Los Angeles, CA | private |
| 13. | Louisiana State University | $916M | $200M | SEC | Baton Rouge, LA | public |
| 14. | University of Florida | $865M | $189M | SEC | Gainesville, FL | public |
| 15. | University of Wisconsin | $838M | $198M | Big Ten | Madison, WI | public |
| 16. | Clemson University | $800M | $196M | ACC | Clemson, SC | public |
| 17. | University of Oregon | $780M | $151M | Big Ten | Eugene, OR | public |
| 18. | University of Arkansas | $776M | $167M | SEC | Fayetteville, AR | public |
| 19. | University of Kentucky | $775M | $174M | SEC | Lexington, KY | public |
| 20. | Auburn University | $772M | $195M | SEC | Auburn, AL | public |
| 21. | University of Iowa | $747M | $167M | Big Ten | Iowa City, IA | public |
| 22. | Michigan State University | $740M | $171M | Big Ten | East Lansing, MI | public |
| 23. | Stanford University | $687M | $180M | ACC | Stanford, CA | private |
| 24. | Florida State University | $673M | $170M | ACC | Tallahassee, FL | public |
| 25. | University of Illinois | $665M | $148M | Big Ten | Champaign, IL | public |
This game right here in 1980 really set everything in motion. FSU came to Lincoln and won. You guys own a 6-2 series lead over us. pic.twitter.com/jnR5HtaJez
— Shawn (Big Red Bass Player) (@Ajkh79) December 6, 2024
Teams with multiple appearances in the National Championship game 🏆
— CFB Kings (@CFBKings) January 16, 2025
(BCS & CFP eras, 1998-2024) pic.twitter.com/nlpidFZCow
The last 12+ win season for each P4 team 🏈
— CFB Tracker (@MatchupTracker) January 8, 2025
Has your team ever accomplished 12+ wins in a single season? What about your rivals? 🤔 pic.twitter.com/BB2vRpPasY
Top 25 college football teams by Instagram followers in January 2025 (official team accounts). https://t.co/fjAcfsq3So pic.twitter.com/Ltddp17Ck4
— SkullSparks (@SkullSparks) January 6, 2025
most accomplished golfer to play on the PGA Tour?
Jeff Sluman 6 Wins, 1 Major, $18.1 Million, 700 Events
Hubert Green, 19 Wins, 2 Majors, $2.6 Million, 607 Events
Paul Azinger 12 Wins, 1 Majors, 14.5 Million, 587 Events
Kenny Knox 3 Wins, 0 Majors, $1.6 Million, 378 Events
Nolan Henke 3 Wins, 0 Majors, $3.6 Million, 347 Events
George McNeill 2 Wins, 0 Majors, $12.2 Million, 318 Events
Jonas Blixt 3 Wins, 0 Majors, $10.5 Million, 235 Events
Daniel Berger 4 Wins, 0 Majors, $25.2 Million 207 Events
Brooks Koepka 9 wins, 5 Majors, $43.4 Million 182 Events
Hank Lebioda 0 Wins, 0 Majors, $3.4 Million 120 Events
Vincent Norrman 1 Win, 0 Majors, $1.9 Million, 49 Events
Now that the NFL Draft is over, my updated Blue Blood Viz is here!!!!
— Kyle Umlang (@kyleumlang) April 27, 2025
All-Time (1869-2025) Top 50 Blue Blood rankings.
Make sure to use your computer and hover over any logo to see the data behind it. 
💻https://t.co/tKTVy2ebnt #ThisIsTexas #HookEm  pic.twitter.com/xnYQUWFIXm
Over 175,000 votes
— Pick Six Previews (@PickSixPreviews) January 23, 2025
% that view the program as a “Blue Blood”
94% Alabama
94% Ohio State
86% Michigan
84% Notre Dame
81% Oklahoma
78% USC
77% Texas
72% Nebraska
- - - - -
42% Penn St
42% UGA
32% Miami
29% LSU
27% FSU
24% Florida
15% Tennessee
15% Clemson
8% Washington
5% Auburn
Most Watched TV Shows of 2024
NFL: 72 College Football: 4
Olympics: 2
College Football: 4
Olympics: 2  Women's CBB: 1
  MLB: 1
  NBA: 0
NHL: 0
NBA: 0
NHL: 0  Men's CBB: 0
MLS: 0
Men's CBB: 0
MLS: 0 

If you're curious about 2020-2023, here ya go. https://t.co/zG1OUFPd9Y pic.twitter.com/6re5Bj1A92
— Eben Novy-Williams (@novy_williams) January 3, 2025